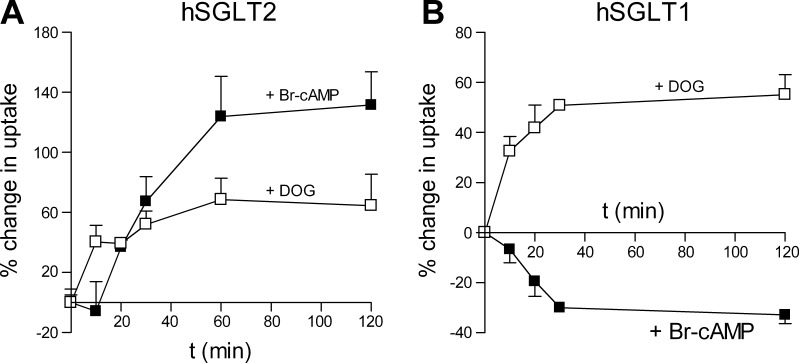
Fig. 2.
Time course of 8-Br-cAMP and DOG effects on hSGLT1 and hSGLT2 transport rate. A: uptake from hSGLT2-transfected cells was measured in control condition and after 10, 20, 30, 60, and 120 min incubation in 8-Br-cAMP (solid squares) or DOG (open squares). Each time point is the mean of at least 6 wells measured from 2 different experiments. Data points are joined only for visualization. Error bars are means ± SE. B: uptake from hSGLT1-transfected cells was measured in control condition and after 10, 20, 30, 60, and 120 min incubation in 8-Br-cAMP (solid squares) or DOG (open squares). Each time point is the result of at least 6 wells measured from 2 different experiments. Data points are joined only for visualization. Error bars are means ± SE.

