Figure 9 .

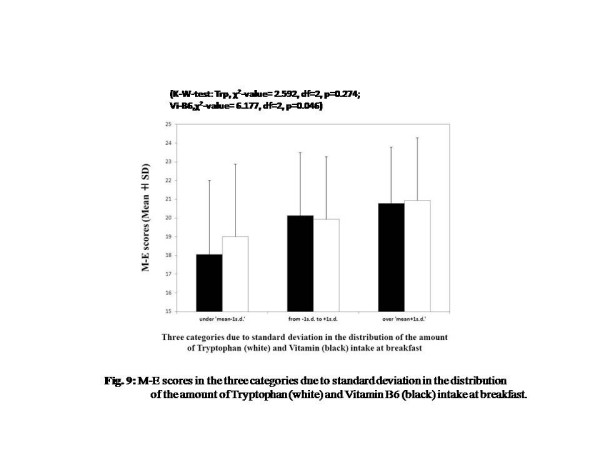
M-E scores in the three categories due to standard deviation in the distribution of the amount of Tryptophan (white) and Vitamin B6 (black) intake at breakfast.

M-E scores in the three categories due to standard deviation in the distribution of the amount of Tryptophan (white) and Vitamin B6 (black) intake at breakfast.