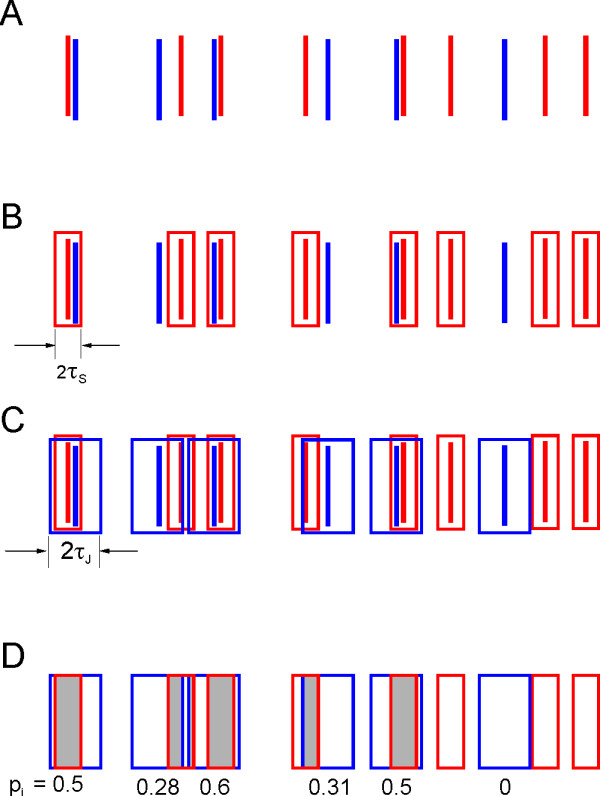
Figure 1.

Using virtual spike jitter to quantify synchrony. (A) A hypothetical segment from two simultaneously recorded spike trains, with spikes from the reference and target train represented as blue and red bars, respectively. (B) By placing a synchrony window (red) of ±τS centered on each target spike, we see that three of the five reference spikes are synchronous. (C) A jitter window (blue) of ±τJ is centered on each reference spike. (D) Areas of overlap between jitter and synchrony windows are shaded; spikes are omitted for clarity. The probability pi that any given reference spike will be synchronous after jittering is given by the shaded fraction of its jitter window, and is indicated below the window. The probabilities are then used to determine the expected number of spike coincidences (∑pi), which is then subtracted from the observed number to yield an estimate of excess coincidences. The latter is normalized by the number of spikes in the reference train and multiplied by a scaling factor to yield the JBSI.
