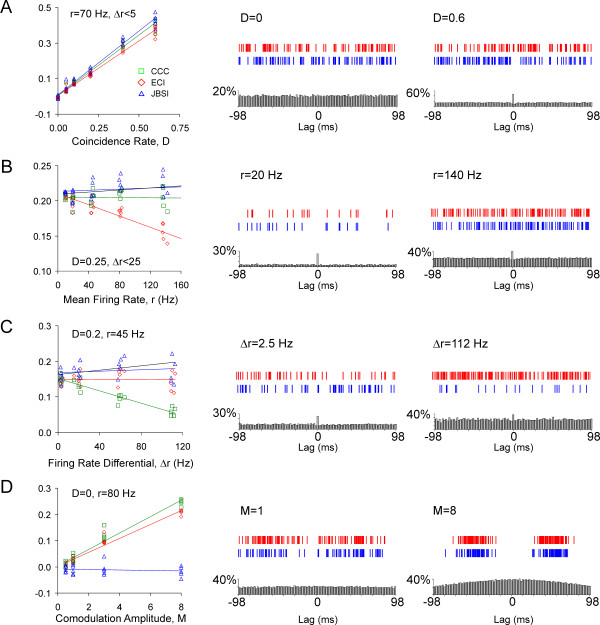
Figure 2.
Comparison of the Jitter-Based Synchrony Index with the Excess Count Index, the cross-correlation coefficient and the corrected Excess Count Index . In the left column of each panel, the indices and their linear regression lines are plotted for a range of simulations in which one parameter of the simulation was varied. (A) The rate of inserted coincidences, D, was varied; (B) the average firing rate, r (defined as the geometrical average of the mean firing rate of the two neurons) was varied; (C) the differential in firing rates, ∆r, was varied; (D) the amplitude of firing rate co-modulation, M, was varied. In the two rightmost columns, 1 s segments of simulated spike trains, representing two extreme values of the varied parameter, are shown above the cross-correlograms (CCGs) computed from the same trains. CCGs were computed in 2 ms bins and the counts normalized by the number of reference spikes. The black regression lines in B and C represent the corrected Excess Count Index (ECIcor); for clarity, the ECIcor data points are not plotted. In A and D, the ECIcor data points precisely overlapped the CCC. Note that the JBSI was the only index that was robust against variations in all tested parameters.

