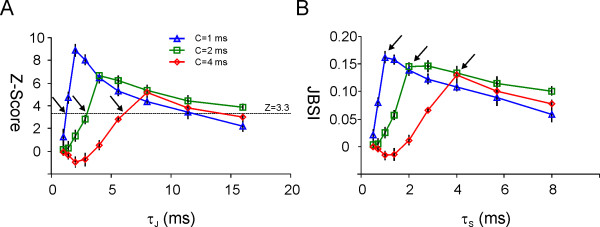
Figure 3.
Estimating temporal precision of firing using the Jitter-Based Synchrony Index. The three superimposed plots represent different simulated paired spike trains; each plot is an average of five runs of the simulation (error bars indicate standard error of the mean). The average firing rate r (approximately 45 Hz) and the rate of inserted coincidences D (0.2) were identical for all pairs, but the precision of synchrony C was varied from 1 to 4 ms. (A) The Z-score is plotted against the jitter span τJ, which was varied from 1 to 16 in √2-fold increments while τS was maintained at τJ/2. The intersections of the three plots with the line Z = 3.3, representing a significance threshold of p = 0.001, correspond to τJ = 1.5, 3 and 6 ms (black arrows). (B) For the same simulations as in (A), the JBSI is plotted for increasing values of the synchrony span τS. Cutoff points, from which the JBSI fell steeply to the left, correspond to τS = 1, 2 and 4 ms (black arrows).

