Figure 5.
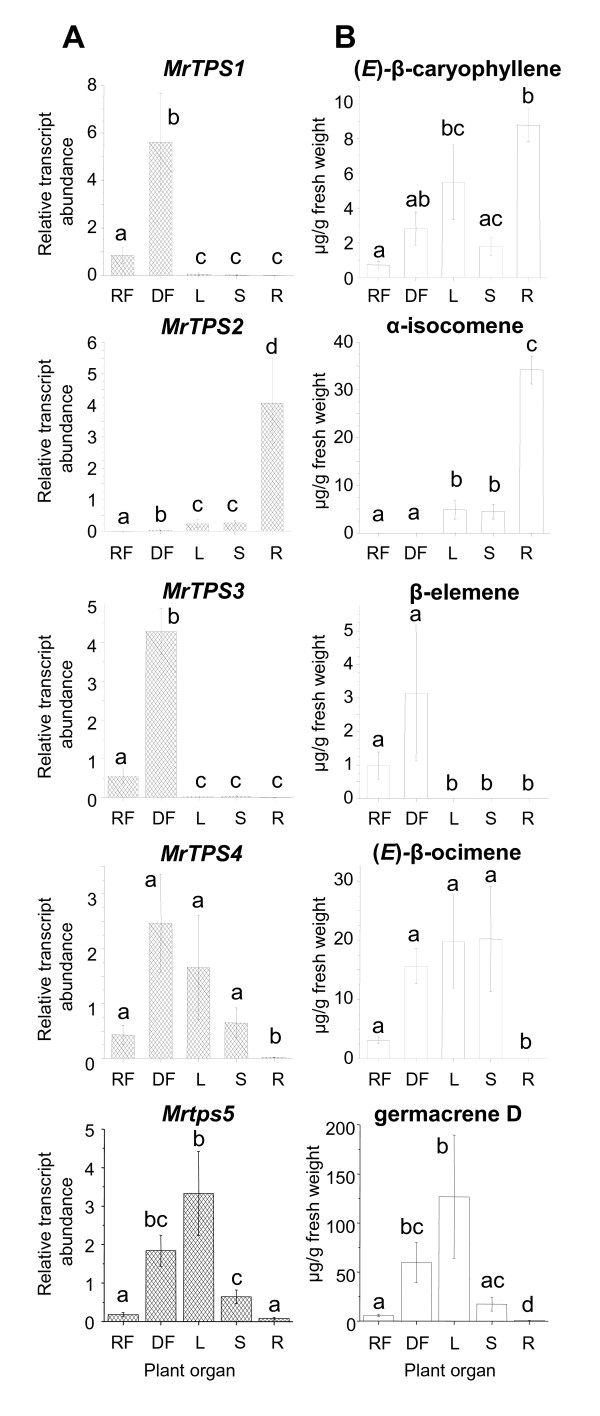
Transcript accumulation of terpene synthase genes (A) and abundance of single TPS products (B) in different plant organs. mRNA accumulation of TPS genes in different plant organs was measured using qRT-PCR. The relative abundance was determined using a standard curve based method. Terpenes were extracted from plant powder with hexane and analyzed using GC-MS and GC-FID. Bars show means ± SE (n = 4). Different letters indicate significant differences between plant organs. Statistical values for terpene synthase genes: MrTPS1 – F = 41.916, p < 0.001; MrTPS2 – F = 49.436, p < 0.001; MrTPS3 – F = 65.752, p < 0.001; MrTPS4 – F = 12.037, p < 0.001; MrTPS5 – F = 30.766, p < 0.001; statistical values for terpenoids see Table 1. RF, ray florets; DF, disk florets; L, leaves; S, stem; R, roots.

