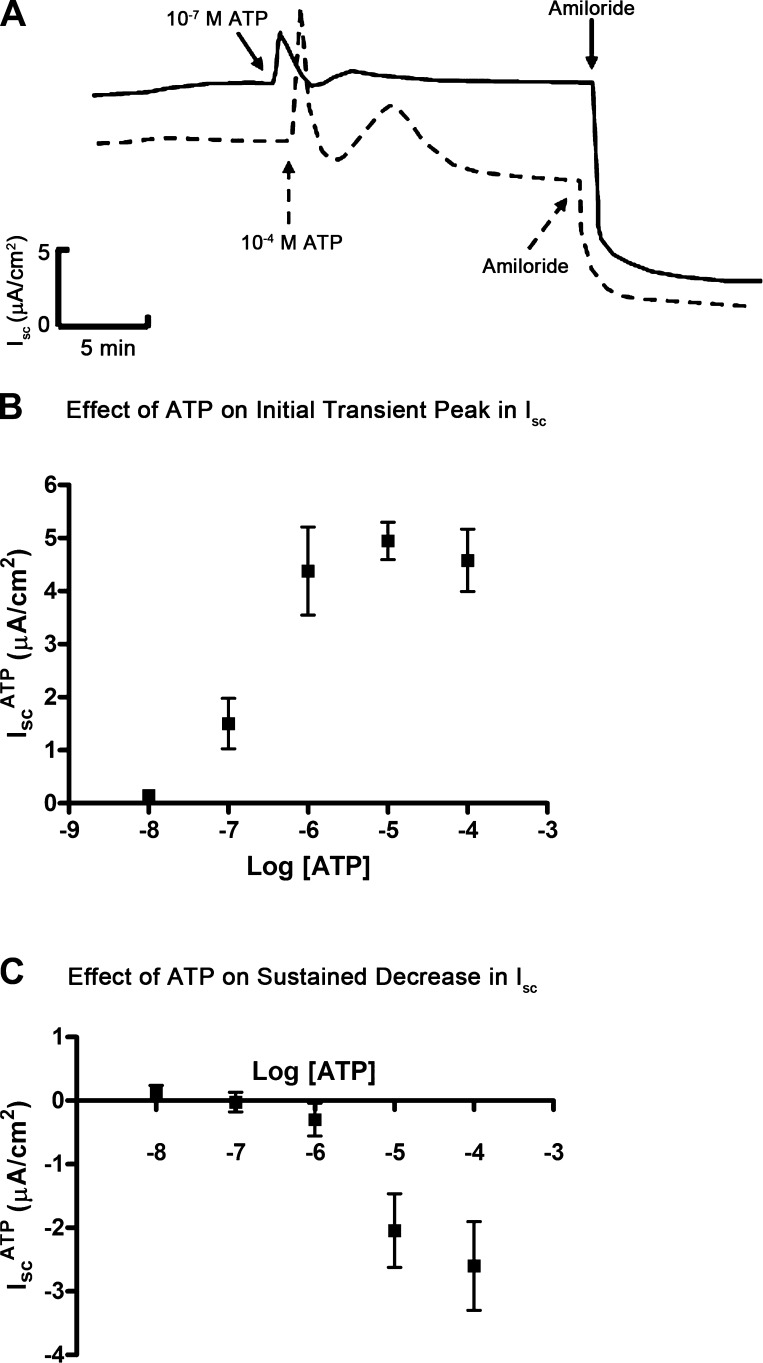
Fig. 2.
ATP dose-response curve in mpkCCDc14 cells. A: superimposed representative Isc traces showing the effect of ATP on Isc at a concentration of 10−7 M (solid line) or 10−4 M (dashed line); amiloride indicates addition of amiloride (10−5 M) to the apical side of mpkCCDc14 cell monolayers. B: dose response for ATP-induced initial peak in Isc (IscATP). C: dose response for ATP-induced sustained decrease in Isc (IscATP). Data are means ± SE (n = 6 filters each).

