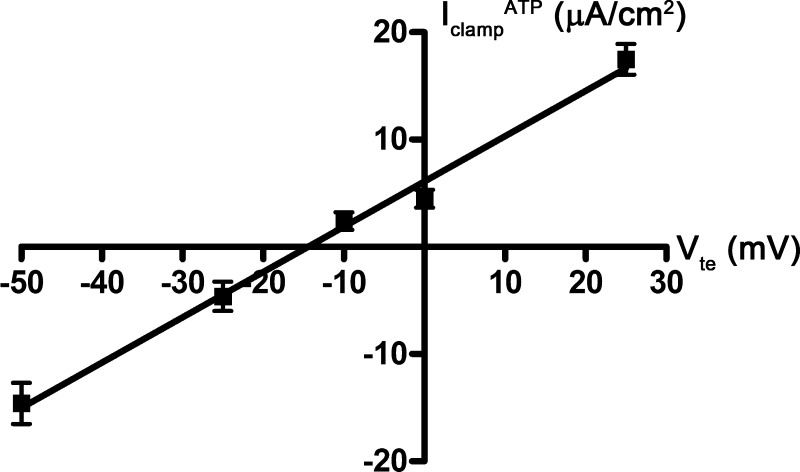
Fig. 3.
Macroscopic current-voltage (I-V) curve for ATP-inducible current in mpkCCDc14 cells. mpkCCDc14 cell monolayers were mounted in an Ussing chamber and clamped to different voltages (−50, −25, −10, 0, and +25 mV). At each voltage (Vte), cell monolayers were treated with ATP (10−5 M), and the resulting clamp current (IclampATP) was measured. Data are means ± SE (n = 6–7 filters each).

