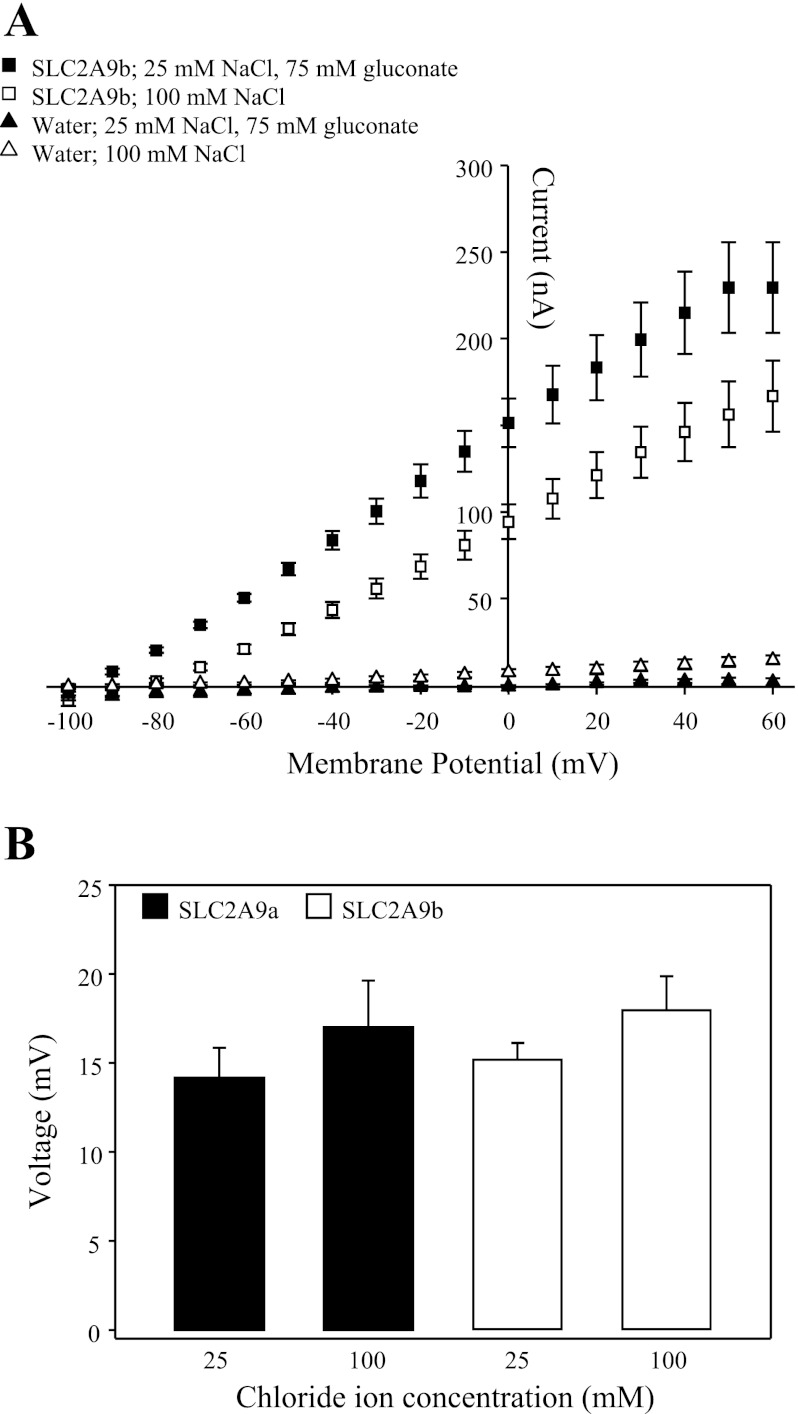
Fig. 4.
Effect of chloride on SLC2A9-mediated transport of urate. A: I-V curves for SLC2A9b were generated from the difference between steady-state currents recorded in the presence and absence of 1 mM urate in medium containing a high Cl− concentration (100 mM NaCl, pH 7.5; □) or in medium in which the Cl− concentration was reduced (25 mM NaCl+75 mM Na+ gluconate, pH 7.5; ■). Membrane voltage was stepped from a holding potential of −90 mV to final potentials ranging between −100 and +60 mV, in 10-mV steps. Urate-induced I-V curves generated in the presence of high and reduced Cl− concentrations were measured in the same SLC2A9b-producing oocytes, and data are averaged from 7 oocytes from the same batch of cells used on the same day. Similar results were seen with SLC2A9a-producing oocytes (data not shown). I-V curves were also measured in water-injected oocytes (triangles), and data are averaged from 7 cells used on the same day. B: mean urate (1 mM)-induced voltage changes in oocytes producing SLC2A9a (filled bars) or SLC2A9b (open bars) were measured in medium containing a high (100 mM NaCl, pH 7.5) or reduced (25 mM NaCl+75 mM Na+ gluconate, pH 7.5) Cl− concentration. Values are means ± SE of 7–9 different oocytes. The data are representative of 2 separate experiments. Voltage changes were not observed in water-injected oocytes (data not shown).

