Fig. 6.
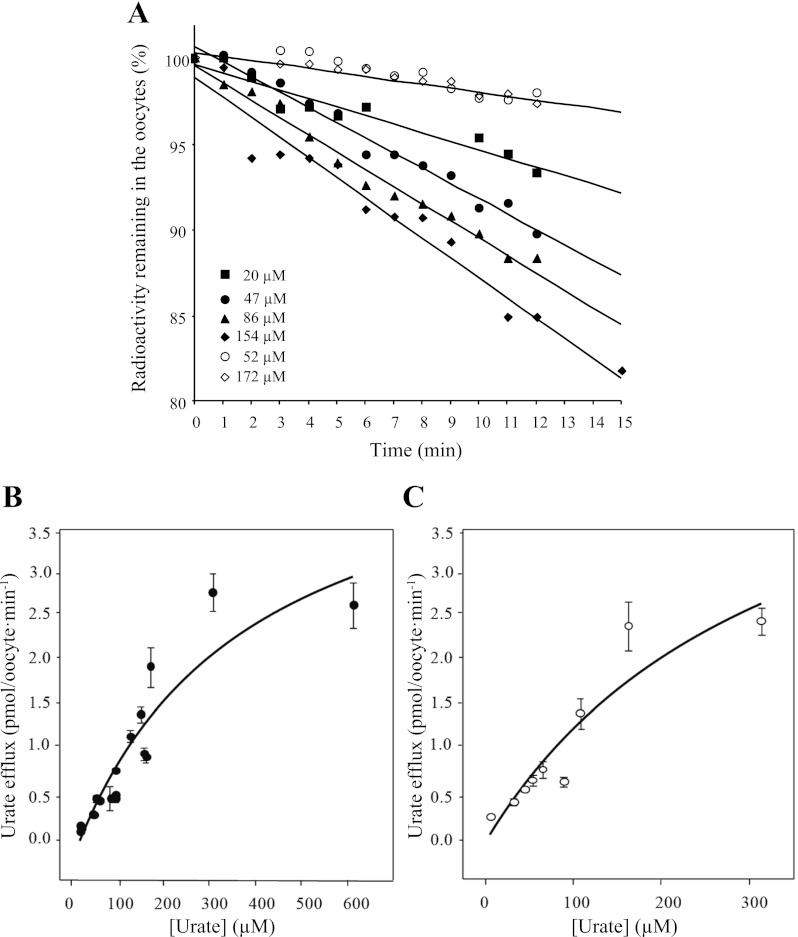
Urate efflux kinetics of SLC2A9. A: representative results demonstrating [14C]urate efflux from [14C]urate- preloaded SLC2A9-producing oocytes (filled symbols) and from water-injected oocytes (open symbols). Magnitudes of the slopes of the lines (±SE), indicating the rates of intracellular urate efflux (% efflux/min) for each concentration, were water-injected oocytes, 0.26 ± 0.06 (52 μM) and 0.21 ± 0.06 (172 μM); SLC2A9a-producing oocytes, 0.46 ± 0.06 (20 μM), 0.89 ± 0.06 (47 μM), 0.92 ± 0.06 (86 μM), and 1.10 ± 0.06 (154 μM). Only low and high intracellular urate concentrations for water-injected oocytes are shown for clarity. B: initial rates of [14C]urate efflux for SLC2A9a-producing oocytes in units of pmol·oocyte−1·min−1 are plotted against the starting internal urate concentration. C: corresponding data for [14C]urate efflux in SLC2A9b-producing oocytes. Fitted apparent Km values were ∼1 mM for both transporter isoforms. Data are representative of 4–6 independent experiments.

