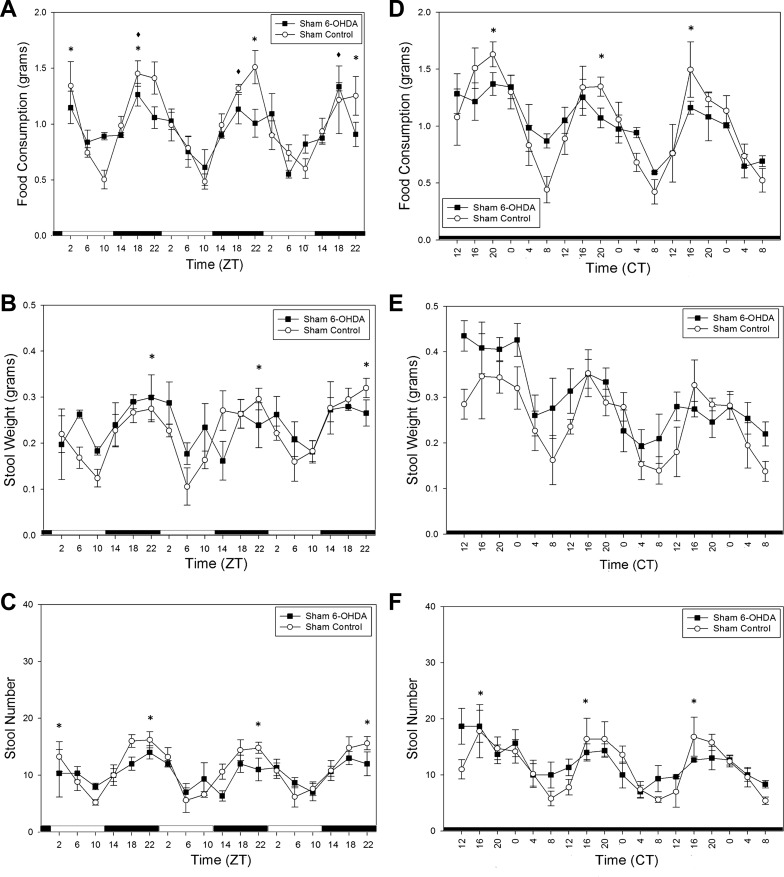
Fig. 5.
Differences in stool output rhythms between 6-OHDA-treated (n = 3) and vehicle-treated (control, n = 5) sham animals during ad libitum conditions. A–C: food consumption, stool weight, and stool number in 6-OHDA- and vehicle-treated sham animals in LD. D–F: food consumption, stool weight, and stool number in 6-OHDA- and vehicle-treated sham animals during DD. *P < 0.05 for sham control. *P < 0.05 for sham 6-OHDA. Values are means ± SE.

