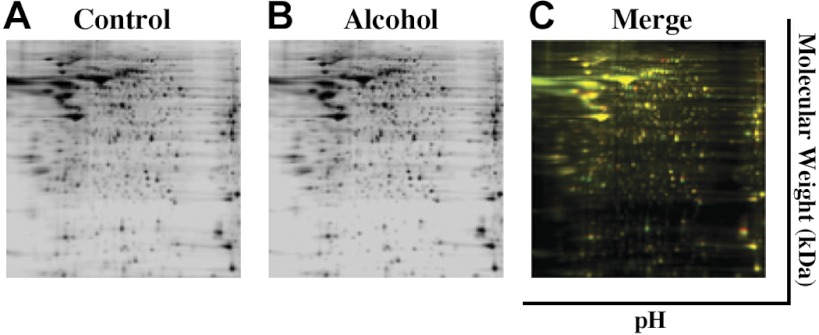
Fig. 3.
Representative two-dimensional (2-D) differential in gel electrophoresis (DIGE) images of paired control and alcohol uterine endothelial samples depicting a rich array of fluorescent spots. Equal amounts of Cy2 (standard with equally mixed samples), Cy3 (control), and Cy5 (alcohol)-labeled samples were mixed and then separated on analytical 2-D DIGE. A and B: black and white images depict fluorescent signals derived from the red and green channels. C: green spots on the 2-D gel depict maternal uterine endothelial proteins that were downregulated by alcohol, whereas red spots were proteins that were upregulated and yellow spots were unaltered by binge alcohol exposure. Adapted with permission from Ramadoss and Magness (69).

