Fig. 6.
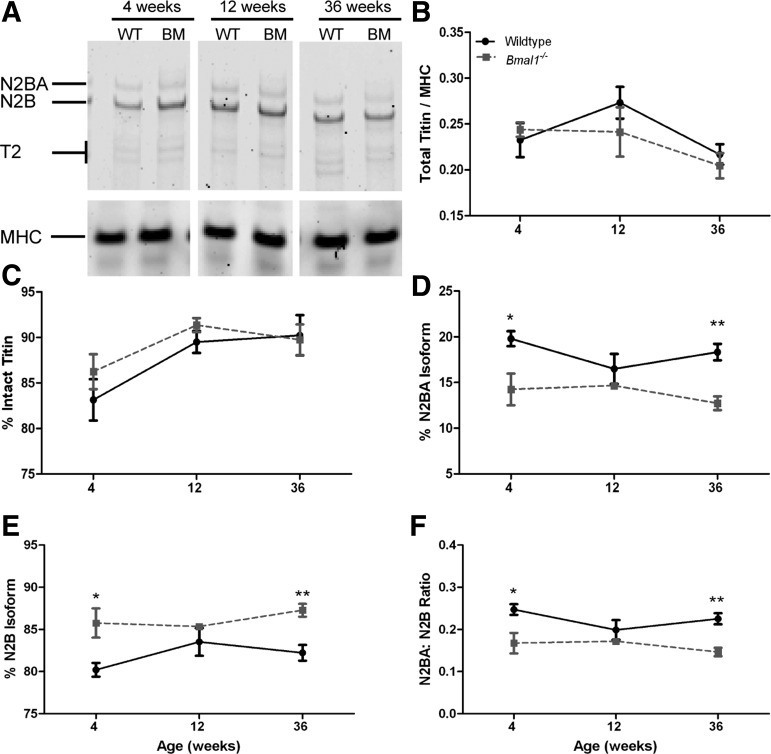
Bmal1−/− mice (BM) show increase of N2B and decrease of N2BA titin isoforms. Representative SDS-vertical agarose gel electrophoresis for titin protein is shown (A). Total titin-to-MHC ratio (B) and the percentage of intact titin (C) were not different between WT and Bmal1−/− mice at any age. The percentage of the compliant N2BA isoform is decreased in the Bmal1−/− mice compared with age-matched controls (D), and this is associated with an increase in the percentage of the stiffer N2B isoform (E). These changes result in a decrease in the N2BA-to-N2B ratio in the 4- and 36-wk-old Bmal1−/− mice compared with WT controls (F). n = 4. *P < 0.05; **P < 0.01.

