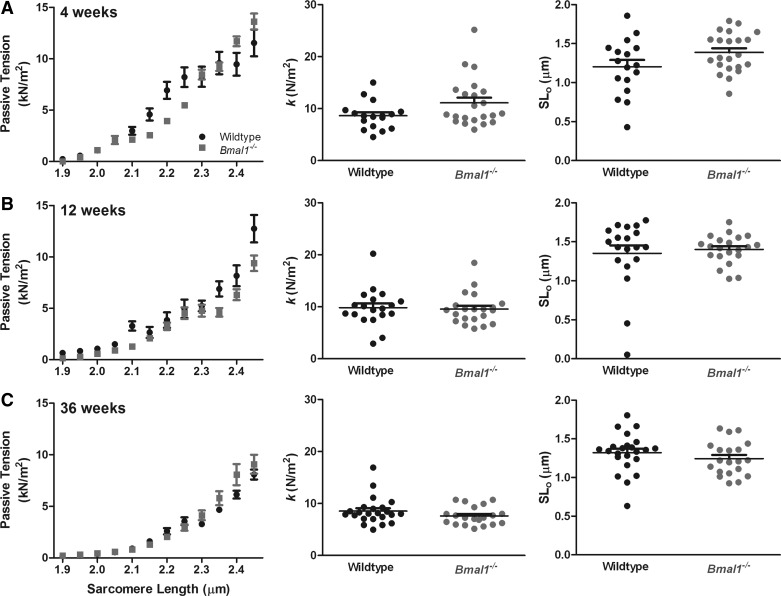
Fig. 8.
Passive tension is not different in Bmal1−/− cardiomyocytes compared with WT controls. Passive tension measurements in single cardiomyocytes from WT and Bmal1−/− mice at 4 wk (A), 12 wk (B), and 36 wk (C) are shown. Individual data points are binned according to their sarcomere length in bins of 0.05 μm to generate graphs (left). Additionally, each curve was fit to an exponential equation: passive tension = exp[k*(SL − SL0)], where SL is the sarcomere length, k is the exponent of stiffness, and SL0 is the sarcomere length at zero load. k and SL0 are plotted on the scatter plots (middle and right). Data are means ± SE; n = 20–24 cardiomyocytes from 4 mice/group.

