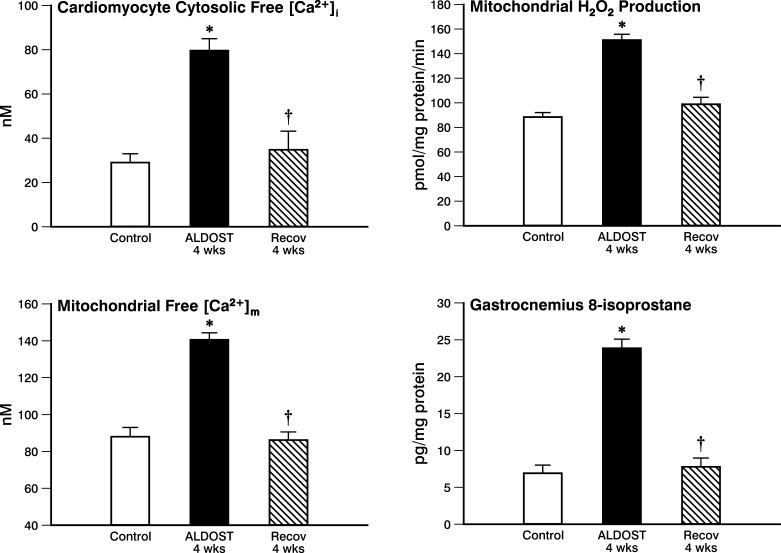
Fig. 3.
Reverse remodeling at cellular/subcellular levels. Cardiomyocyte cytosolic free Ca2+ ([Ca2+]i; top left) and mitochondrial free Ca2+ ([Ca2+ ]m; bottom left) are each increased at 4-wk ALDOST but recover to control levels after 4-wk Recov. Cardiac mitochondrial Ca2+ overloading is accompanied by evidence of oxidative stress with increased H2O2 production by these organelles, which returns to controls levels with 4-wk Recov. Evidence of lipid peroxidative and 8-isoprostane content is seen in the gastrocnemius muscle at 4-wk ALDOST and then resolves with 4-wk Recov. *P < 0.05 vs. controls; †P < 0.05 vs. ALDOST.

