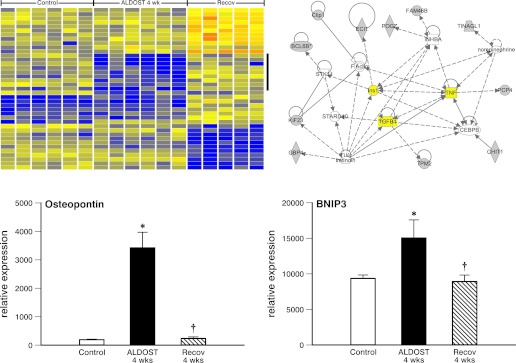
Fig. 5.
Reverse remodeling at molecular level for heart. A heat map of differentially expressed (P < 0.01) genes seen for 6 controls, 6 samples at 4-wk ALDOST, and 5 samples after 4-wk Recov (top left) is shown. Vertical bar identifies 9 genes forming a cluster which followed an expression pattern of decreased expression (blue color) at 4-wk ALDOST compared with controls and 4-wk Recov. The ingenuity pathway system was used to identify interconnecting pathways, one of which includes TNF-α, transforming growth factor (TGF)-β1, and insulin signaling (top right). Osteopontin and BNIP3 gene expression are shown at bottom left and right (see text).

