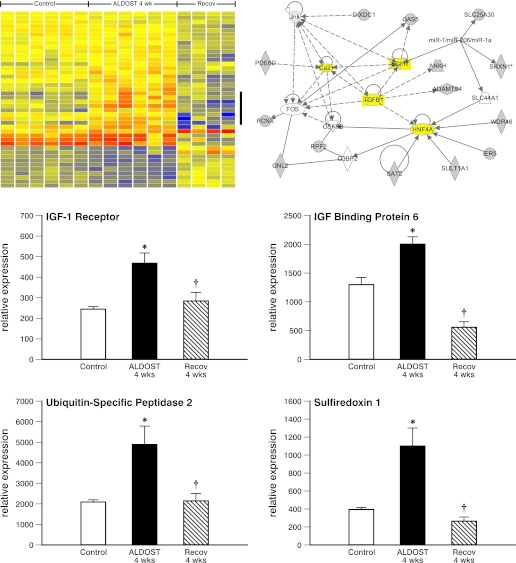
Fig. 6.
Reverse remodeling at molecular level for skeletal muscle. Differentially expressed (P < 0.01) genes are presented as heat map with upregulated genes in red and downregulated genes in blue (top left). Vertical bar identifies 7 genes as a cluster with increased expression compared with 6 controls, 6 ALDOST 4-wk, and 4 samples after 4-wk Recov. Ingenuity pathway analysis (top right) reveals a pathway (in yellow) centered around Ca2+, TGF-β1, epidermal growth factor (EGF) receptor, and hepatocyte nuclear factor (HNF)-4a. Middle right and left: upregulation of IGF-1 receptor and IGF-binding protein-6 at 4-wk ALDOST and return to baseline with Recov, respectively. Bottom right and left: upregulation of ubiquitin-specific peptidase 2 and sulfiredoxin 1 at 4-wk ALDOST and that were normalized after Recov, respectively. See text.

