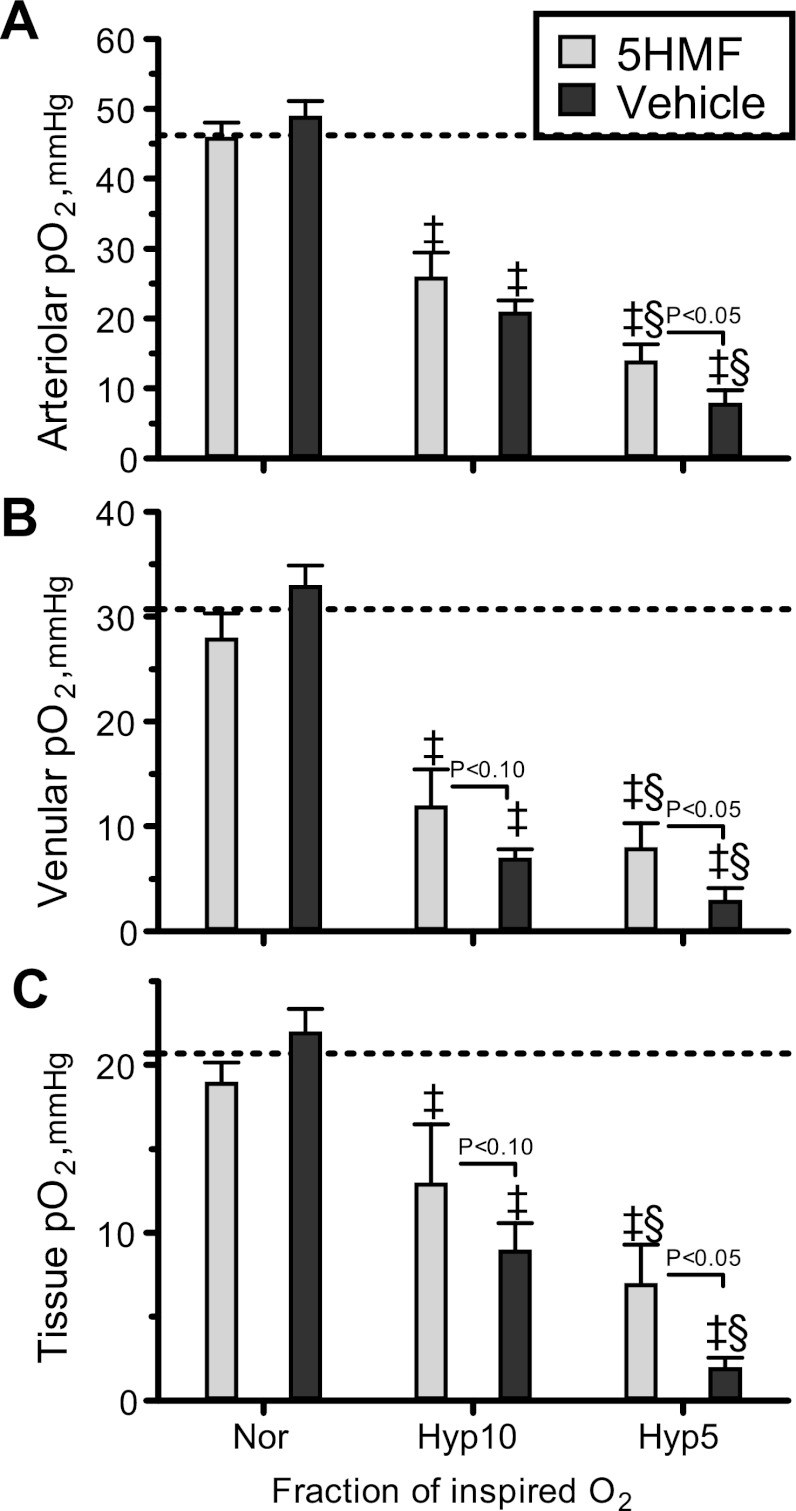
Fig. 5.
Intravascular and extravascular (tissue) partial pressure of O2 during the acute hypoxia protocol. ‡P < 0.05 compared with normoxia. §P < 0.05 compared with 10% O2 hypoxia. Broken lines represent baseline Po2 values [A: 46.2 mmHg (A); V: 30.7 mmHg (B); tissue: 20.9 mmHg (C)] (3).

