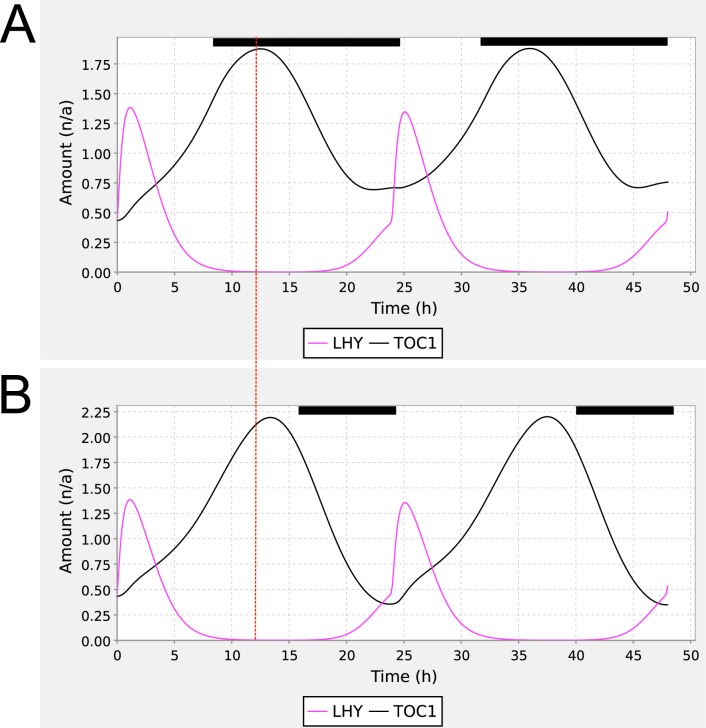
Figure 2.
Shift in TOC1 peaks in Locke 3 loop model. Reproduction of Figure 3 from Locke et al. (2006), using the 3-loop circadian clock model BIOMD0000000089 enhanced with the SBML step function. The figure shows simulations of TOC1 mRNA (black) and LHY mRNA (magenta) under photoperiods of (A) LD8:16 and (B) LD16:8. The vertical dotted line highlights the shift in the peak phase of TOC1 mRNA levels from LD8:16 to LD16:8, whereas the peak phase of LHY mRNA is not shifted. Dark periods are indicated using the black bars above the traces. The parameterization of the step function for panel A was Q0 = 0, Q1 = 1, TC = 24 h, TP = 8 h, T = 0.1 h, and f = 0 h (A); for panel B, as for panel A but TP = 16 h.

