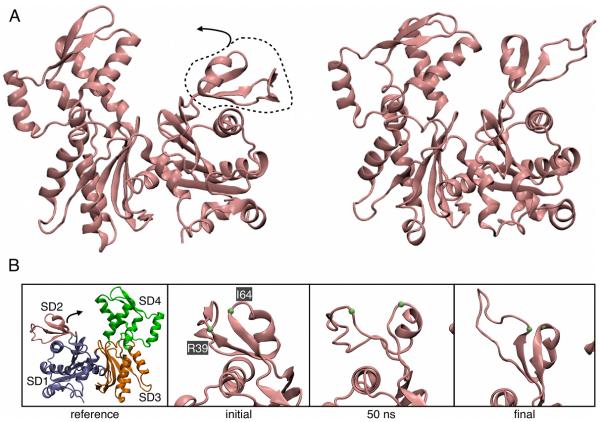
Fig. 2.
Changes in mother actin filament subunit M6 during the MD simulation. (A) Ribbon diagrams of initial and final views of the front side of subunit M6 with SD2 circled and the direction of SD2’s relaxation identified with an arrow. (B) Close-up views of the back side of subunit M6’s SD2 region with the Cα atoms of R39 and I64 labeled. Left, reference actin subunit structure identifying SD1—4. Mid-left, initial structure from the EM model. Mid-right, 50 ns of simulation. Right, 75 ns of simulation.

