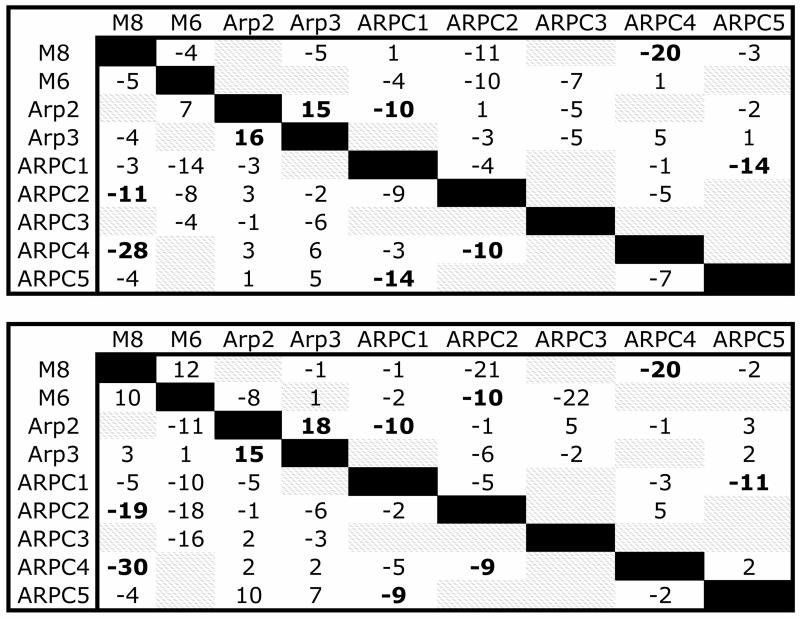
Fig. 3.
Subunit-level “difference contact map” for the mother filament and Arp2/3 complex for both filament simulations (Branch08 is on top, Branch 11 on bottom). The matrix elements show the net change in contacts between subunits represented in the rows and column. The map considers both the contacts on subunit i due to subunit j as well as the contacts on subunit j due to contact with i. In the lower diagonal portion of the map the row is the subunit where contacts are counted and the column is the contacting subunit. In the upper diagonal portion of the map the column is the subunit where contacts are counted and the row is the contacting subunit. For example, M6 loses 5 of its initial contacts with M8, but M8 loses only 4 of its initial contacts with M6. Difference values in bold indicate similar changes for both the Branch08 and Branch10 simulations.

