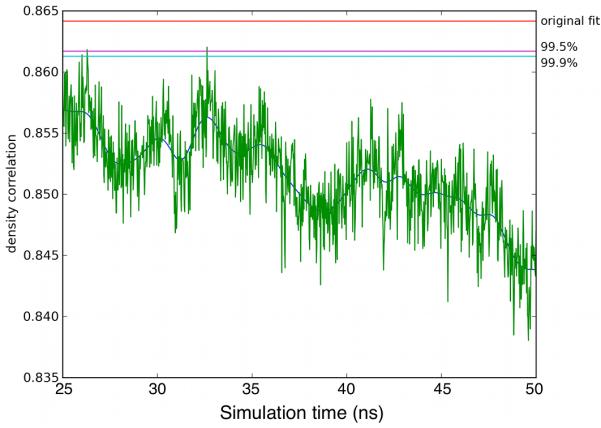
Fig. 7.

The time series showing the correlation of models extracted from the 25-50ns of the MD trajectory with the density map of the branch junction reconstructed from experimental electron-tomograms (green). The correlation of the original docking-based model is marked in red; the 99.5% and 99.9% confidence limits are marked in cyan and magenta respectively.
