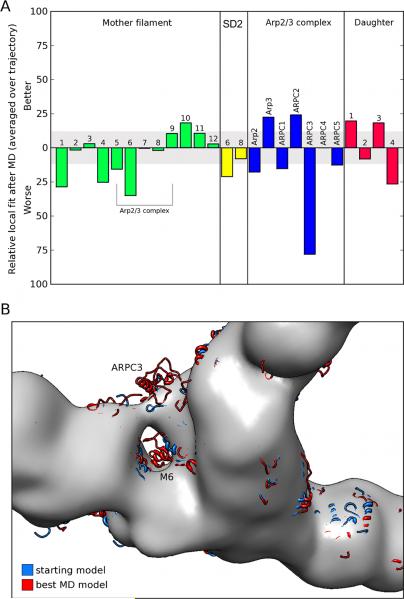
Fig. 8.
Local changes in fit of the equilibrated molecular dynamics (MD) model and the EM-based model to the density map constructed from EM tomography. (A) Changes in number of alpha carbons inside the density (contour level as in B). (B) Direct visual comparison between the density map constructed from EM tomography (gray surface representation) and the EM-based model (starting model, blue) and the best-fitting MD model (red) in the region occupied by the Arp2/3 complex.

