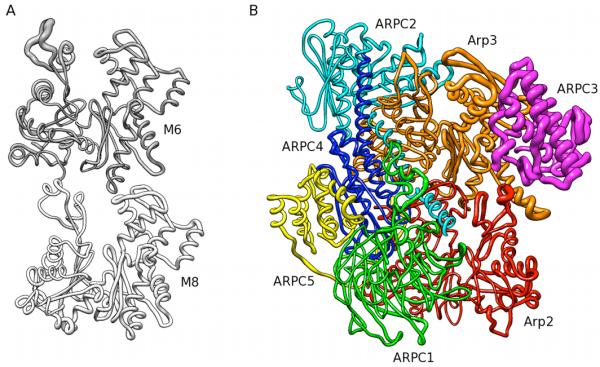
Fig. 9.

Root-mean-square differences (RMSD) mapped onto cartoon representations of mother filament subunits M6 and M8 and Arp2/3 complex. The thickness of the backbone traces is proportional to RMSD. (A) RMSD between representatives of the snapshots from the MD simulation mapped onto mother filament subunits M6 and M8. (B) RMSD between the original EM-based model and the best-fitting model of the MD trajectory mapped onto the Arp2/3 complex. The RMSD magnitude was scaled by 0.5 with respect to A.
