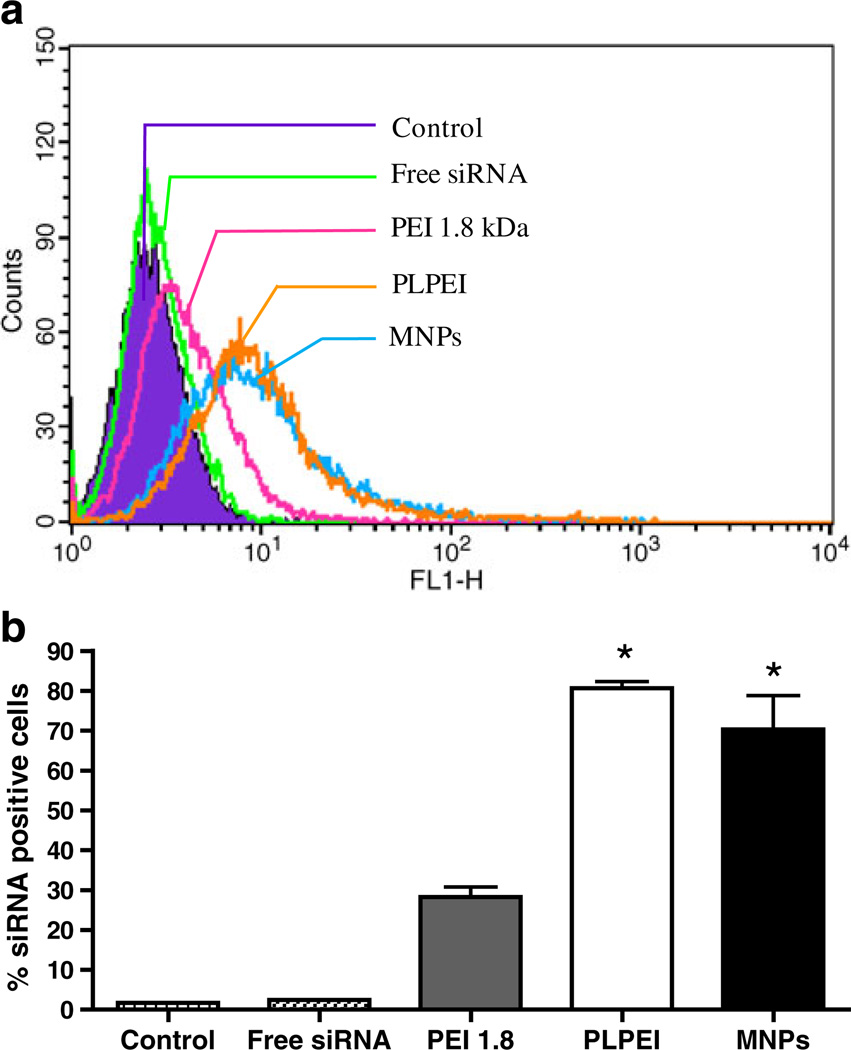
Fig. 5.
Cellular uptake of FAM-labeled siRNA in various complexes and MNPs. a. Changes in FACS histograms indicative of siRNA-positive cells after 24 h of incubation following 4 h of treatment with different formulations. b. Bars represent quantitative analysis of FACS histograms in (a) to obtain the percentage of cells positive for FAM-siRNA. Data are expressed as the mean±SD (n=3; *p<0.05 vs free siRNA and PEI 1.8 complexes)

