
Figure 3.
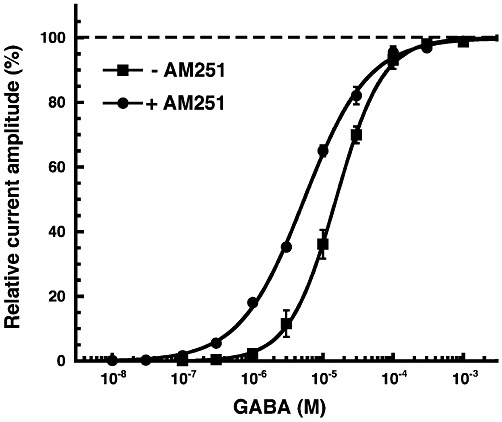
GABA concentration response curve in the absence and presence of 1 µM AM251. Increasing concentrations of GABA were applied in the absence and presence of 1 µM AM251. Individual curves obtained in the absence of AM251 were first normalized to the observed maximal current amplitude and subsequently averaged. Curves obtained in the presence of AM251 were treated in the same way. As such a procedure does not detect effects of AM251 on maximal current amplitudes, additional experiments were performed as described in the Results. Mean ± SEM of experiments carried out with at least four oocytes from two batches of oocytes are shown.