
Figure 5.
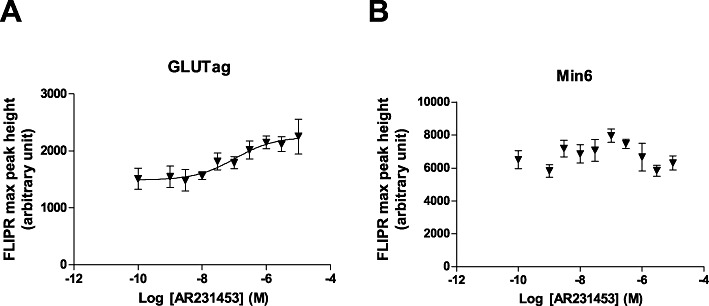
FLIPR signal representing calcium influx in GLUTag (A) and Min6 cells (B) in response to a 10-point dose titration of AR231453 (0–10 µM). GLUTag and Min6 cells were washed and loaded for 30 min at 37°C with a calcium-sensitive dye. The plate was cooled to room temperature and compounds were added while changes in intracellular calcium content were monitored for up to 20 min using a FLIPR. Maximum peak height in each well was recorded as representing calcium influx. Data are are means ± SEM (n= 8). The dose curve was generated and the EC50 value was calculated with the sigmoidal dose–response (variable slope) algorithm in the GraphPad Prism 5.02 software. The data from Min6 cells did not converge.