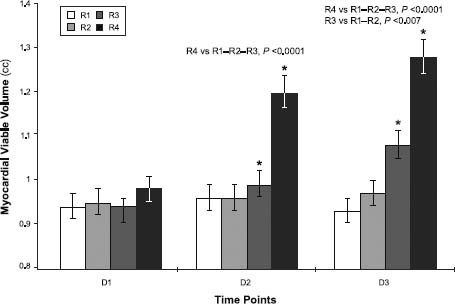
Fig. 4 Graph shows myocardial viability as measured by micro-positron emission tomographic analysis: 1 month after surgical induction of acute myocardial infarction (D1), and at 1 month (D2) and 2 months (D3) after the therapeutic treatments in each rat group (R).
D = distinct time point
