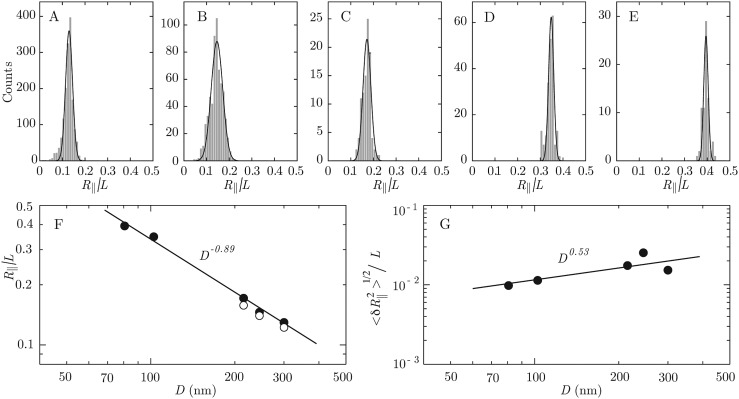
Figure 4.
(a)–(e) Distributions in relative extension of λ-DNA in 5x TBE buffer (pH 8.5). The channel cross-sections are 300 × 300, 200 × 300, 150 × 300, 100 × 105, and 100 × 60 nm2 from A to E. The solid lines denote Gaussian fits. (f) Mean values of the relative extension. The closed symbols refer to λ-DNA, whereas the open symbols denote values pertaining to T4 DNA. The solid line represents a fit to the data. (g) As in panel (f), but for the width of the distribution.

