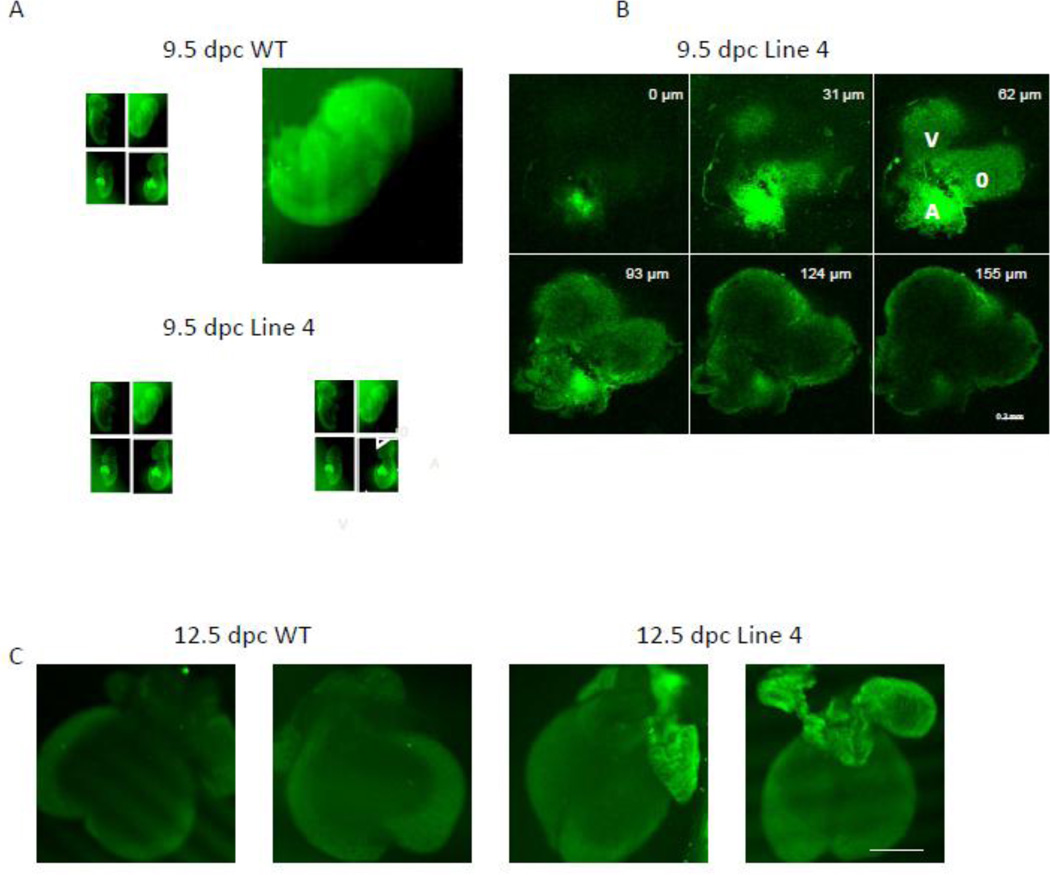
Figure 4. Gain of function KATP transgene is mainly expressed in atrial tissue.
(A) Confocal images of two 9.5 dpc WT (control) littermate embryos (upper two images) and two 9.5 Line 4 littermate embryos hearts (lower 2 images). Note prominent GFP fluorescence in Line 4 transgenic mice throughout the hearts. A=atrium, V=ventricle, O=outflow. Sizing bar indicates 1 mm. (B) Z-sectioning (with depth information in the right upper corner of each image) confocal images of the heart from 9.5 dpc Line 4 embryo (right lower embryo in A). A=atrium, V=ventricle, O=outflow. Sizing bar indicates 0.2 mm. (C) Confocal images of two 12.5 dpc WT (control) littermate embryonic hearts (left 2 images) and two 12.5 Line 4 littermate embryonic hearts (right 2 images). Sizing bar indicates 1 mm.

