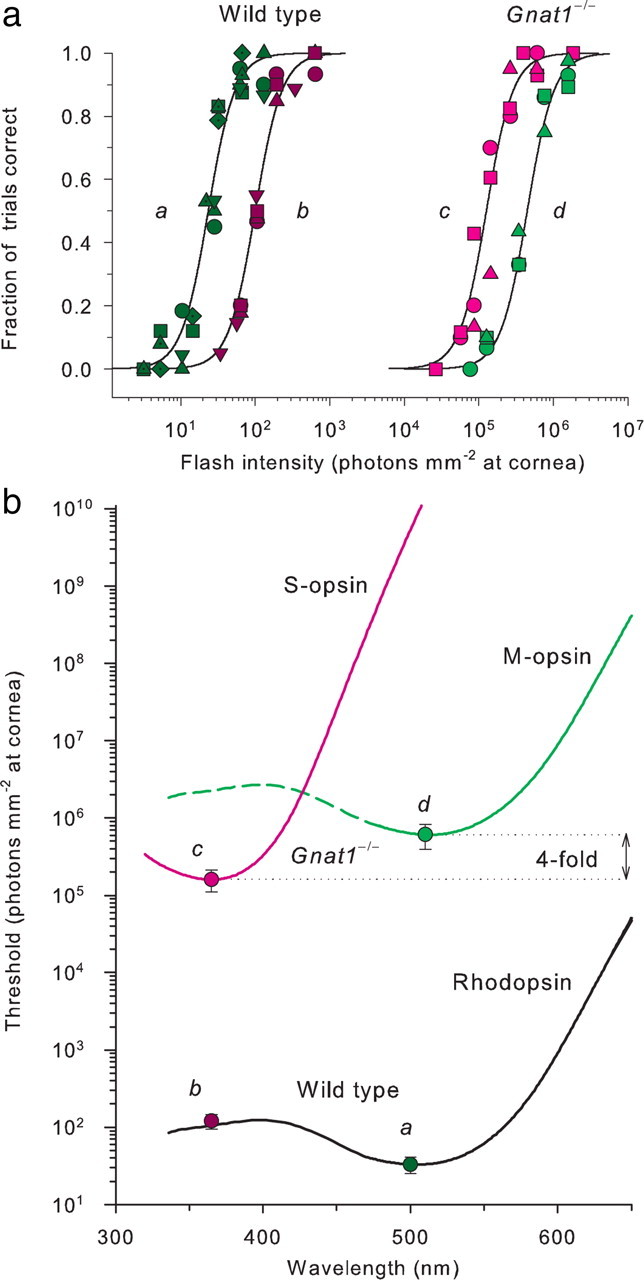
Figure 5.

Absolute visual thresholds of dark-adapted WT and nightblind (Gnat1−/−) mice for midwave and ultraviolet targets. a, FOS data, on the left, obtained from WT mice (n = 6) with 500 nm (dark green symbols) and 365 nm (dark violet symbols) test flashes, and on the right, obtained from Gnat1−/−) mice (n = 3) with 365 nm (magenta) and 510 nm (light green symbols) test flashes. Target size was 5.3°; its duration was ≤1 ms. Two to four FOS data sets were averaged for each mouse. The smooth curves are logistic functions, fitted to the composite data by eye; to extract thresholds, each FOS data set was fitted separately. b, Absolute threshold intensities (mean ± 2 SEM) of dark-adapted WT and Gnat1−/− mice for midwave and ultraviolet stimuli extracted from the experiments illustrated in a and plotted as function of wavelength; the italic labels (a, b, c, d) near the threshold data correspond to the four experimental conditions correspondingly labeled in a. The smooth curves are pigment template spectra for mouse S-opsin (magenta), M-opsin (green), and rhodopsin (black) in situ taken from Lyubarsky et al. (1999), who used them to fit the spectral sensitivity of the mouse a-wave and cone b-wave of the electroretinogram; they were derived from the pigment template formulation of Lamb (1995).
