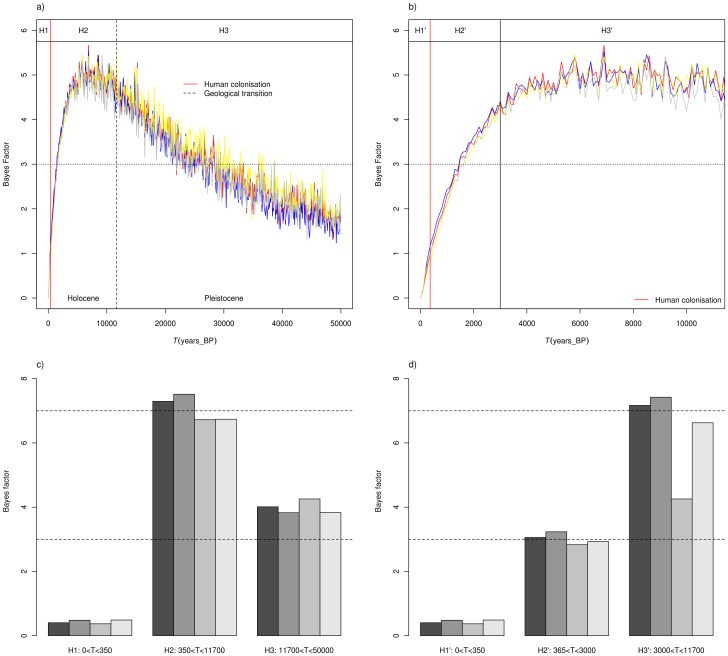
Figure 6. Most likely period since the population size started to decrease.
Natural logarithm of the Bayes factors have been computed to determine during which period C.newtoni population most likely started to decline. BF values of parameter T (time since the beginning of the demographic event) for the whole population (P) were computed for each 100 year time steps and are plotted for the last 50,000 (a), and 11,700 years (b). This represents the weighted evidence in favor of each phase against the cumulative evidence of all other phases taken together. Horizontal dashed-dotted lines represent the threshold values above which BF values can be considered as positive evidence [35]. Vertical black red line corresponds to the year 1663 in which the Island was colonized by the first humans. H1 to H3 and H1’ to H3’ represent the six time period hypothesis tested in c and d. In panel c) and d) bar plot represent BF values of parameter T of each time period hypothesis (H1 to H3 and H1’ to H3’) against the cumulative evidence of the two other phases taken together, for each of the four independent runs. Horizontal dashed-dotted lines represent the threshold values above which BF values can be considered as positive evidence [35].

