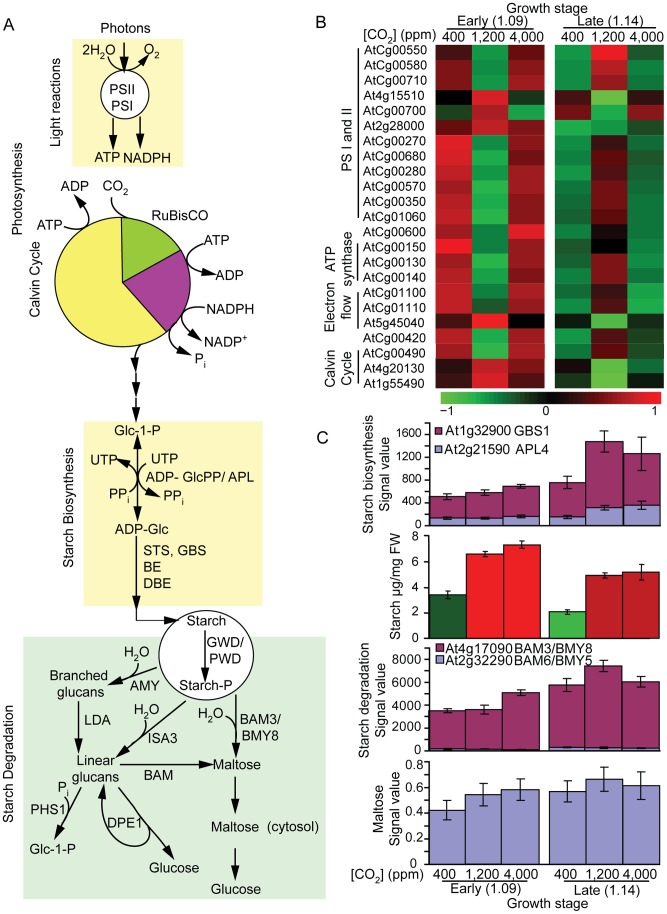
Figure 4. Influence of [CO2] and development on photosynthesis and starch metabolism.
A) Photosynthesis and starch biosynthesis and degradation pathways. B) Heat maps of the transcript profiles of photosynthesis. For each gene, its expression level was normalized across all samples so that the mean expression is 0 and the variance is 1. Higher levels are represented with color red of increasing intensity, and lower levels are represented with green of increasing intensity. The increased or reduced expression is relative to the mean expression. All transcript levels shown was statistically significant (p-value ≤0.001) with 2 fold or more increase or decrease at any one treatment. C) Starch biosynthesis, starch content, starch degradation and maltose content (n = 3 biological replicates ×3 analytical replicates). Starch levels were significantly higher in elevated and SE [CO2] treatments (students t-test p-value <0.05) than the control.

