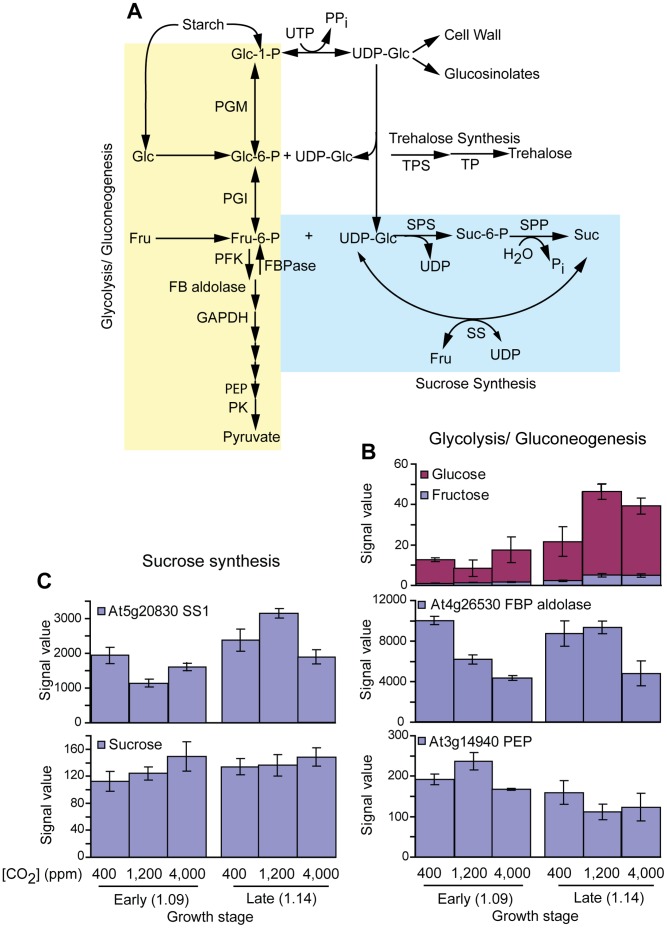
Figure 6. Glycolysis/gluconeogenesis, trehalose and sucrose biosynthesis.
A) Glycolysis/gluconeogenesis, trehalose and sucrose biosynthetic pathways. B) Transcript and metabolite profiles of glycolysis/gluconeogenesis. C) Transcript and metabolite profiles of sucrose biosynthetic pathways. All transcript and metabolite levels shown had a statistically significant response (p-value ≤0.001) and more than 2 fold increase or decrease during any treatment.

