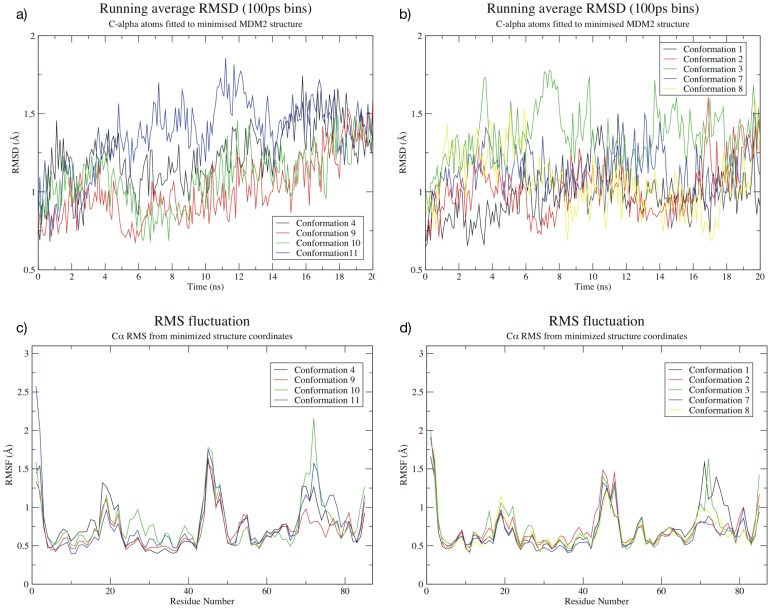
Figure 4. Behavior of parallel (left) and anti-parallel (right) Phe-Nap-iPr conformations of the arylamide compound.
a) RMSD relative to initial minimized parallel conformation; b) RMSD relative to initial minimized anti-parallel conformation; c) RMS fluctuation of C-alpha atoms from initial minimized parallel conformation; and d) RMS fluctuation of C-alpha atoms from initial minimized anti-parallel conformation. The RMSD calculations tend to increase over time, but converge towards similar values after longer simulation times. The RMSF calculations exhibit similar behavior to that observed in Figure S6 (Text S1), indicating that similar regions of the protein remain more flexible.

