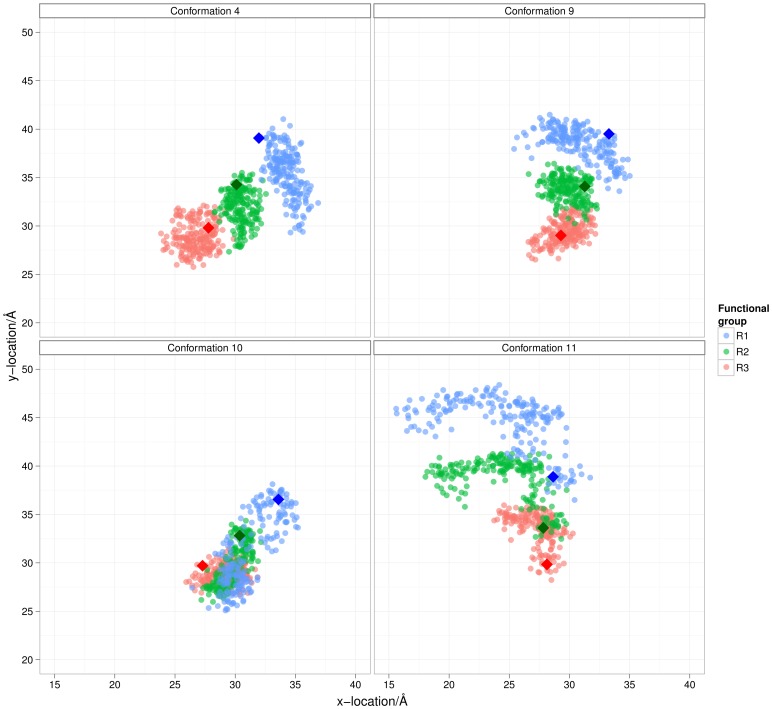
Figure 7. Ether oxygens from parallel conformations of Phe-Nap-Leu projected onto a plane defined by Cα atoms from Tyrosine 56, Methione 62 and Valine 93.
Data points are color coded depending on which ether oxygen they belong to: R1 (Blue); R2 (Green); and R3 (Red). Data points were plotted at 10 ps intervals starting after 4 ns of data collection. Values at t = 0 ps are plotted with diamonds. Graphs show image of starting conformation and data from: a) conformation 4; b) conformation 9; c) conformation 10; and d) conformation 11.

