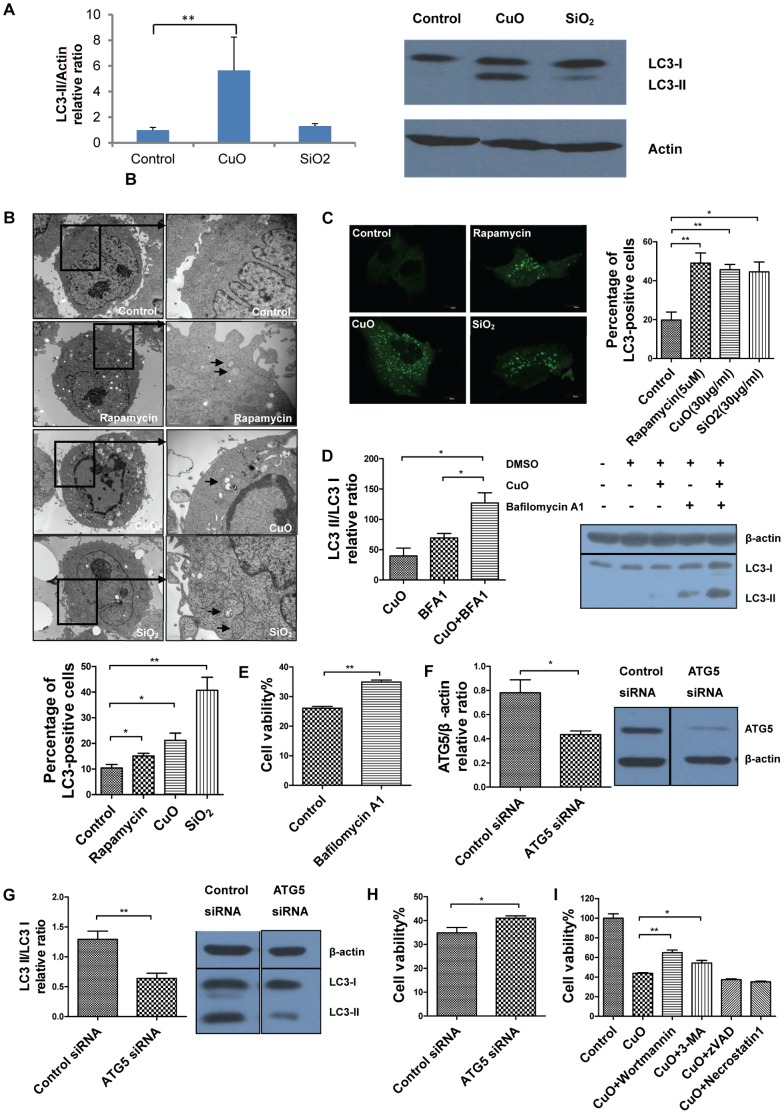
Figure 3. Copper oxide nanoparticles induce autophagy in A549 cells.
(A) Western blot analysis of LC3-I and LC3-II in A549 cells treated with CuO or SiO2 NPs (30 µg/ml) for 12 h, bar graph indicates the LC3 II/β-actin relative ratio (B) EM images of A549 cells treated with control, rapamycin (5 µM), CuO (30 µg/ml) or SiO2 (30 µg/ml); bar graph indicates the percentage of autophagy-positive cells (C) Confocal images of A549 cells transfected with LC3-EGFP plasmid and treated with control, rapamycin (5 µM), CuO (30 µg/ml) or SiO2 (30 µg/ml); bar graph indicates the percentage of LC3-positive cells (D) Western blot analysis of LC3-I and LC3-II in A549 cells treated with bafilomycin A1 (50 nm) 1 h before exposure to CuO NPs (30 µg/ml) for 3 h, bar graph indicates the LC3 II/LC3 I relative ratio (E) MTS assay results for A549 cells treated with bafilomycin A1 (50 nm) 1 h before exposure to CuO NPs (30 µg/ml) for 18 h (F) Western blotting analysis of the efficiency of ATG5-knockdown efficiency by ATG5 siRNA, bar graph indicates the Atg5/β-actin relative ratio (G) Western blotting analysis of the expression of LC3-I and LC3-II in ATG5 siRNA treated cells or control siRNA treated cells, bar graph indicates LC3 II/LC3 I relative ratio (H) Cell viability of A549 cells upon treatment of CuO NPs (30 µg/ml) for 24 h in ATG5 siRNA treated group and control siRNA treated group (I) MTS assay results for A549 cells treated with 30 µg/ml CuO NPs and cell death inhibitors for 24 h; **p<0.01 versus control and *p<0.05 versus control.

