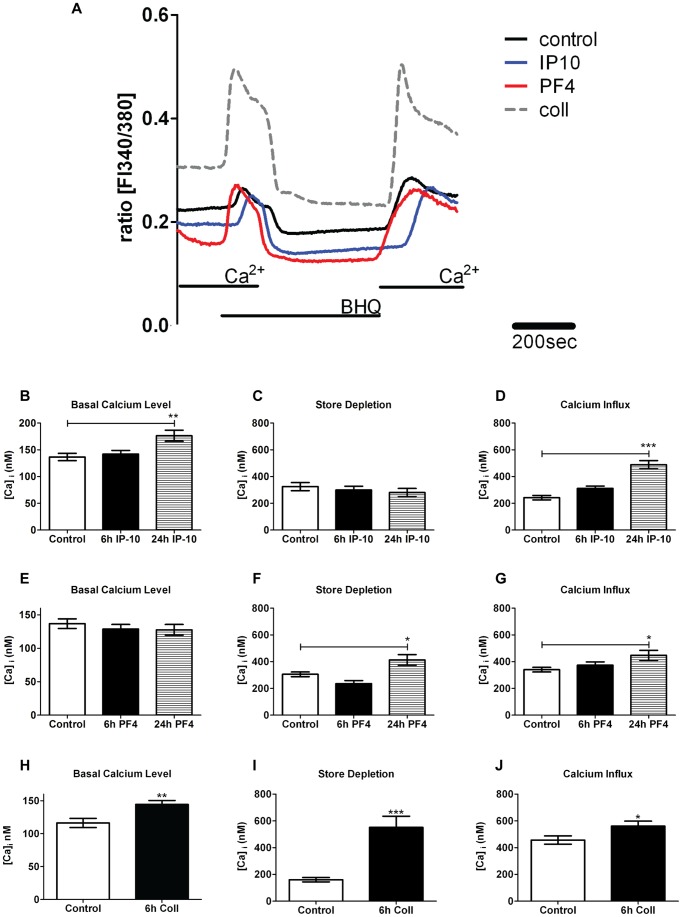
Figure 6. Effect of PF4, collagen type I and IP-10 on calcium (Ca2+) handling of hPAECs.
(A) Representative Ca2+ recording in hPAECs. Bar graphs show the basal Ca2+ levels, store depletion (measured as peak of the Ca2+ release) and Ca2+influx (measured as mean amplitude of the Ca2+ signal when external Ca2+ was readmitted) of untreated control cells, and cells treated for 6 h and/or 24 h with, (B) 400 ng/ml of PF4, (C) 100 µg/ml of collagen type I and (D) 600 ng/ml of IP-10 (Number of analyzed cells n = 35–109; * p<0.05, ** p<0.01, *** p<0.001 compared to control untreated cells).

