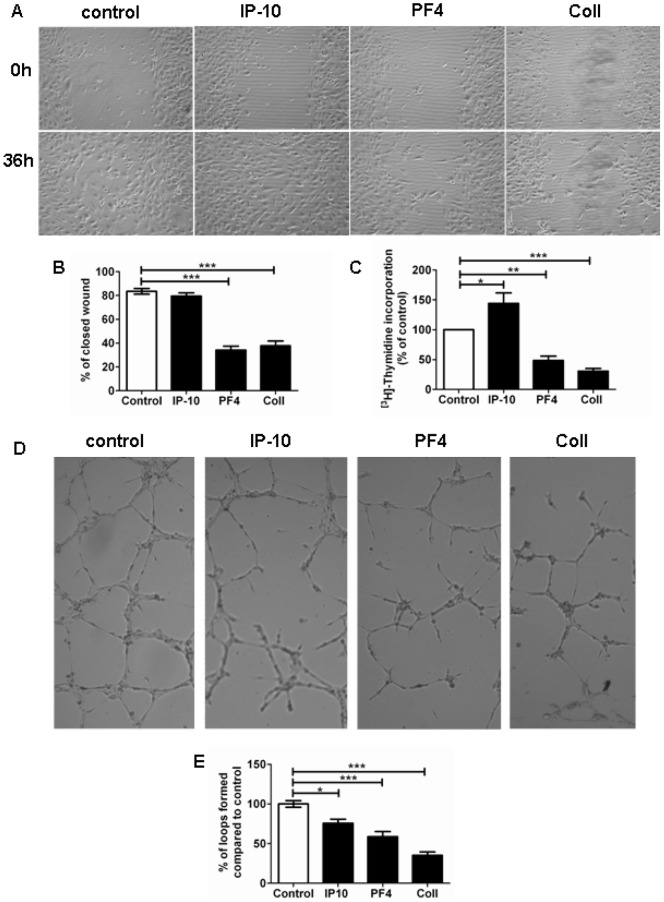
Figure 7. Effect of IP-10, PF4 and collagen type I on hPAEC function.
(A) Representative images of migration assay showing the effect of IP-10, PF4 and collagen type I on hPAECs. (B) Quantitative data of wound healing after 36 h (number of experiments n = 3). (C) Bar graph summarizing the effect of these factors on hPAEC proliferation compared to untreated hPAECs (n = 3). (D) Representative image (4X) of vessels formed after 6 h in Matrigel® under different conditions. (E) Bar graph representing the percentage of formed loops compared to control (n = 3) (* p<0.05, ** p<0.01, *** p<0.001 compared to untreated cells).

