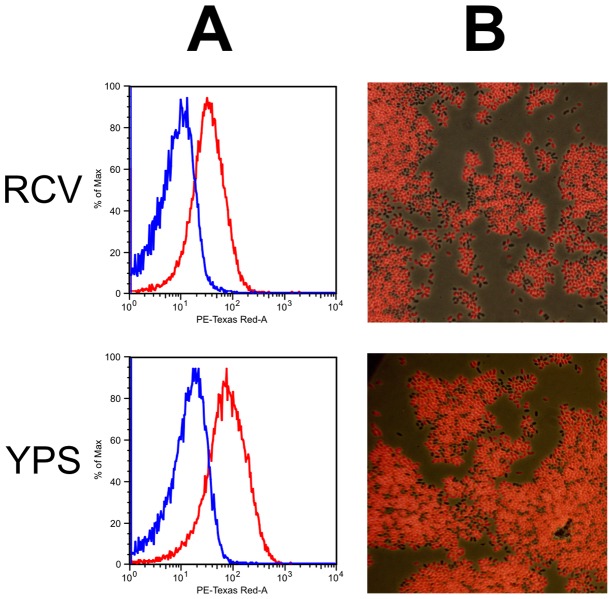
Figure 2. Fluorescence emitted from puf promoter reporter gene fusion cultures.
A. Flow cytometry plots of emission at 610 nm from SB1003 cultures on the X-axis against cell counts as percentage of the maximum on the Y-axis. Cultures were grown to stationary phase in either YPS complex medium (upper panel) or RCV minimal medium (lower panel). The negative control data (cells lacking plasmid pPmC); blue) were overlaid with experimental data (cells containing plasmid pPmC; red). Graphs shown are single representative experiments. B. Fluorescence microscopy of the same cultures. Photographs of cells illuminated with white light were overlaid with fluorescence images of the same microscope field.

