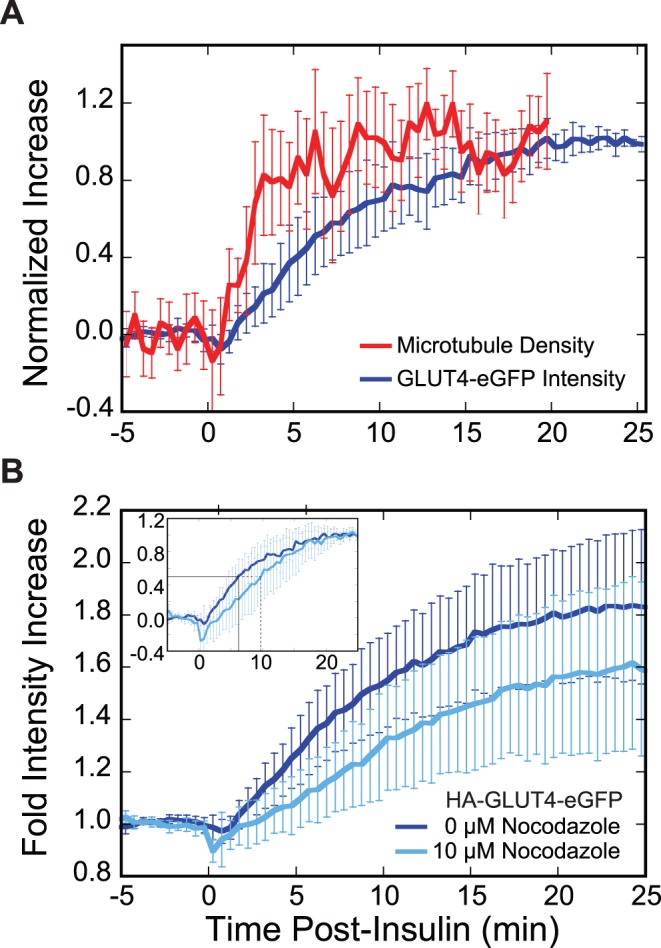
Figure 2. Time courses of HA-GLUT4-eGFP intensity and microtubule density increase.

(A) Insulin increases microtubule density in the region of the cell illuminated by TIRF microscopy. Adipocytes transfected with constructs either to visualize the GLUT4 or microtubule time course were serum-starved prior to stimulation with 100 nM insulin at t = 0 min. Images were acquired using TIRF microscopy at 1 frame per 10 s. Intensity or density increase for each cell was normalized from 0 (average intensity or density prior to insulin addition) to 1 (intensity at last 1 minute or density at last 8 minutes of time course). Plotted is the mean ±95% confidence interval for each point (HA-GLUT4-eGFP, n = 13 cells; mCherry-tubulin, n = 18 cells). (B) Nocodazole pre-treatment decreases the fold change in GLUT4 intensity in response to insulin. Adipocytes expressing HA-GLUT4-eGFP were serum-starved and pre-treated with 0 µM (dark blue, n = 13 cells) or 10 µM (light blue, n = 7 cells) nocodazole for a minimum of 20 min prior to stimulation with 100 nM insulin at t = 0 min. Images were acquired using TIRF microscopy at 1 frame per 10 s. Plotted is the time course of the mean fold intensity increase ±95% confidence interval. There is a significant difference (two-tailed t-test; p-value <0.05) between the two time courses at the half-time for HA-GLUT4-eGFP intensity increase (t = 6.3 min, 0 µM Noc). Due to heterogeneity in the magnitude of the insulin response (Figure 1B inset), a two-tailed t-test performed at t = 25 min does not yield a significant p-value (p-value >0.05). However, since there is a temporal relationship between time points, a new p-value, P, can be calculated by taking this relationship into consideration (see Methods). Comparing the last several minutes of the plateaus gives a significant difference (P<0.05) between the 0 µM Noc and 10 µM Noc time courses. (Inset) Time course replotted to show the intensity increase normalized from 0 (average intensity prior to insulin addition) to 1 (intensity at last minute of time course). Plotted is the mean ±95% confidence interval. Half-times are plotted (0 µM Noc, t 1/2 = 6.3 min, solid black line; 10 µM Noc, t 1/2 = 9.8 min, dashed black line).
