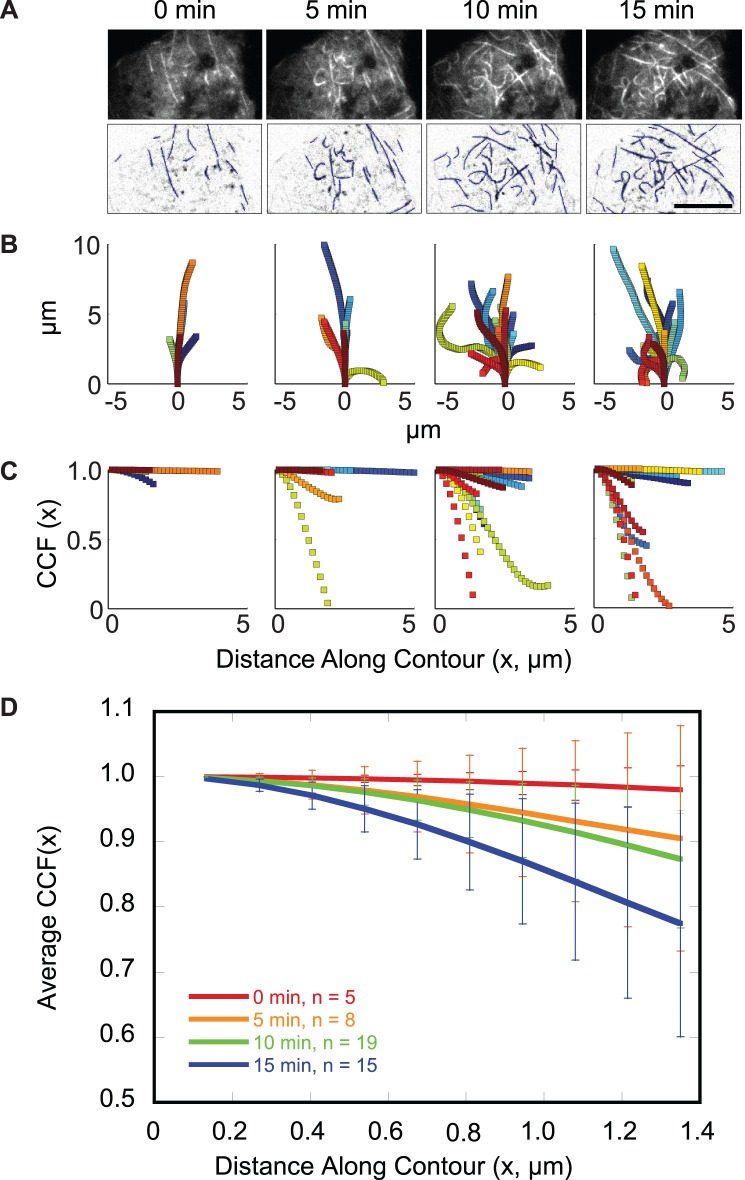
Figure 3. TIRF microscopy reveals a population of highly curved microtubules at the surface of 3T3-L1 adipocytes.
Adipocyte transfected with mCherry-tubulin was serum-starved prior to stimulation with 100 nM insulin at t = 0 min. Images were acquired using TIRF microscopy at 1 frame per 10 s. Elapsed time from insulin addition is indicated. See Video S2. (A) (Upper) Unprocessed and (Lower) background-subtracted, inverted contrast images of an adipocyte at the indicated times following insulin stimulation. Microtubule contours are overlaid in blue. Scale bar is 10 µm. (B) Contours for microtubules at least 3 µm in length were replotted to share the same origin (0 min, 5 contours; 5 min, 8 contours; 10 min, 19 contours; 15 min, 15 contours). (C) Cosine correlation function for microtubule contours shown in (B), see supplement for details (Materials S1: Cosine correlation function, Figure S3). (D) The average CCF up to the minimum contour length for microtubule contours shown in (C) are plotted at 0 (red), 5 (orange), 10 (green), and 15 (blue) minutes post-insulin. Error bars represent the 95% confidence interval.

