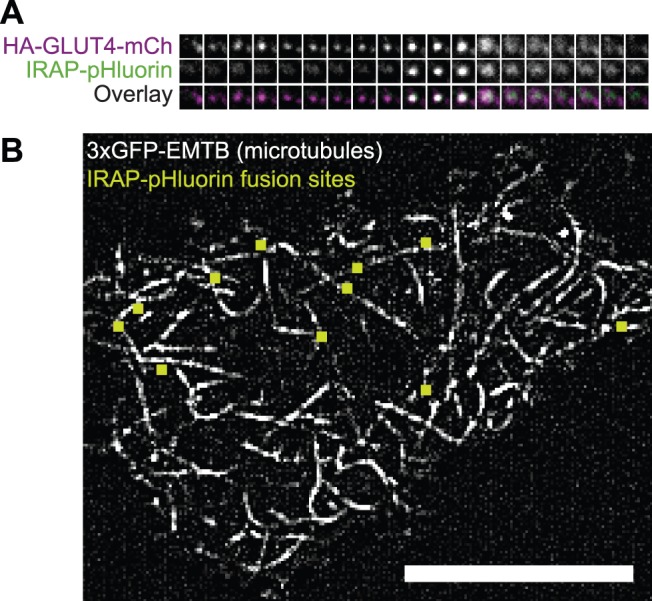
Figure 5. Sites of IRAP-pHluorin vesicle fusion occur in proximity to microtubules at the cell surface.

Adipocytes co-transfected with the indicated constructs were serum-starved prior to stimulation with 100 nM insulin. Images were acquired using TIRF microscopy at an acquisition rate of 20 frames per 1 s. (A) Fusion of a single GLUT4 vesicle with the plasma membrane. Vertical panels represent consecutive frames of the recording. Each horizontal panel displays a single channel of a Dual-View image: (Top) HA-GLUT4-mCherry, (Middle) IRAP-pHluorin, (Bottom) Overlay. Each box is 1.89 µm×1.89 µm. (B) Fusions occur in proximity to microtubules visible in TIRF microscopy. Displayed is a 50 frame (2.5 s) maximum intensity projection image of an adipocyte co-expressing mCherry-IRAP-pHluorin and 3×GFP-EMTB. The image has been background-subtracted to better visualize microtubules. Sites of vesicle fusion during the 2.5 s are overlaid (green squares). Scale bar is 10 µm. See Video S10.
