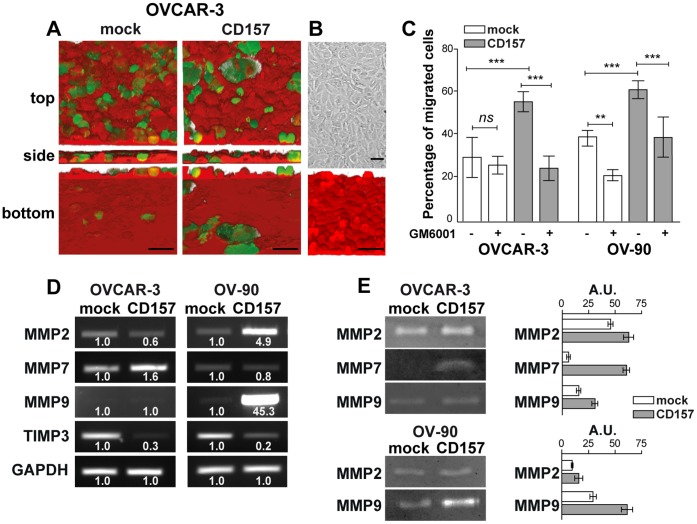
Figure 5. CD157 overexpression promotes invasion of mesothelium by OVCAR-3 and OV-90 cells and increases matrix metalloproteinase expression and activity.
(A) Ovarian cancer cell migration through a mesothelial monolayer. Met-5A mesothelial cells were labeled with CellBrite™ Red and grown to confluence on fibronectin-coated coverslips. CFSE-stained tumor cells were plated onto the monolayer. After 6 h (OVCAR-3 cells) or 2.5 h (OV-90 cells) at 37°C, sample were fixed and analyzed using an Olympus FV300 laser scanning confocal microscope by sequential scanning of the XY planes recorded along the Z-axis (step size: 1.25 µM). Series of confocal optical XY images were processed using a 3D reconstruction program (bioView3D software, Bio-Image Informatics, University of California, Santa Barbara, CA). Top, orthogonal and bottom views are shown (scale bar: 50 µM). (B) Mesothelial layer integrity was verified by confocal microscopy analysis in CellBrite™ Red-labeled samples. Samples were analyzed with an Olympus FV300 laser scanning confocal microscope and by Nomarski differential interference contrast (DIC) optics. Scale bars : 50 µM. (C) Transmesothelial migration of OVCAR-3 and OV-90 cells. Where indicated, OVCAR-3/CD157, OV-90/CD157 and the corresponding mock cells were treated for 1 h with GM6001 (25 µg/ml) before seeding onto Met-5A mesothelial cell monolayer. Results are expressed in terms of percent of transmigrated cells calculated as the ratio of cells that crossed the mesothelial layer to the total number of cells in the field. At least ten fields have been counted for each sample. Results are expressed as the mean ± SEM of three independent experiments. P values were derived from analysis of variance (ANOVA) with Dunnett correction. **P<0.01, ***P<0.001, ns, not significant. (D) sqRT-PCR expression of MMP2, MMP7, MMP9 and TIMP3 in engineered OVCAR-3 (left panel) and OV-90 cells (right panel). Densitometry quantifies the levels of expression of MMP compared with GADPH. (E) Gelatin zymography and casein zymography were used to quantify MMP2, MMP9 and MMP7 activity, respectively, in cell-free conditioned media from OVCAR-3/CD157, OV-90/CD157 and the corresponding mock cells (left panel). Zymographic bands from all samples were quantified by densitometry (right panel). The enzyme activities are expressed as arbitrary units. Results are from one representative experiment performed in triplicate and are expressed as the mean ± SD.

