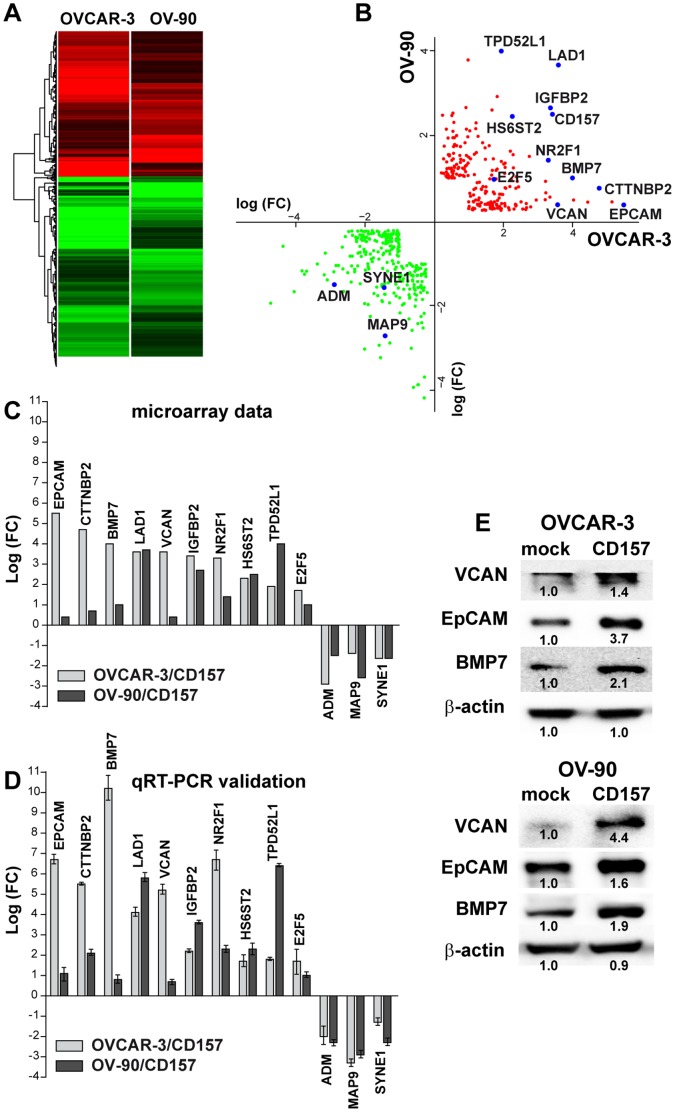
Figure 7. Gene expression profiling of OVCAR-3 and OV-90 cells overexpressing CD157.
(A) Hierarchical clustering applied to the expression matrix of genes similarly regulated in both OVCAR-3 and OV-90 cells overexpressing CD157, using Euclidean distance as similarity metrics and complete linkage as the linkage method. A red-to-green gradient was used to indicate, for each gene, levels of up- or down-regulation. (B) Dot plot shows 378 significantly modulated genes (163 up-regulated and 215 down-regulated) shared by OVCAR-3/CD157 and OV-90/CD157 cells. Single genes are indicated by red (up) and green (down) data points. (C, D) A panel of modulated genes was selected and validated by qRT-PCR. (C) Fold changes of the various indicated genes in OVCAR-3 and OV-90 cells following CD157 overexpression are shown. (D) qRT-PCR validation of the genes shown in panel C. The comparative CT method was used to determine gene expression in CD157-transfected cells relative to the value observed in the mock-transfected cells, using TBP as normalization control. Histograms report the means ± SD of a qRT–PCR experiment conducted in triplicate. (E) The expression of VCAN, EpCAM and BMP7 was examined in OVCAR-3/CD157, OV-90/CD157 and the corresponding control cells by western blot analysis. Densitometry quantifies the expression level of the indicated proteins relative to β-actin. Results shown are representative of three independent experiments with similar results.

