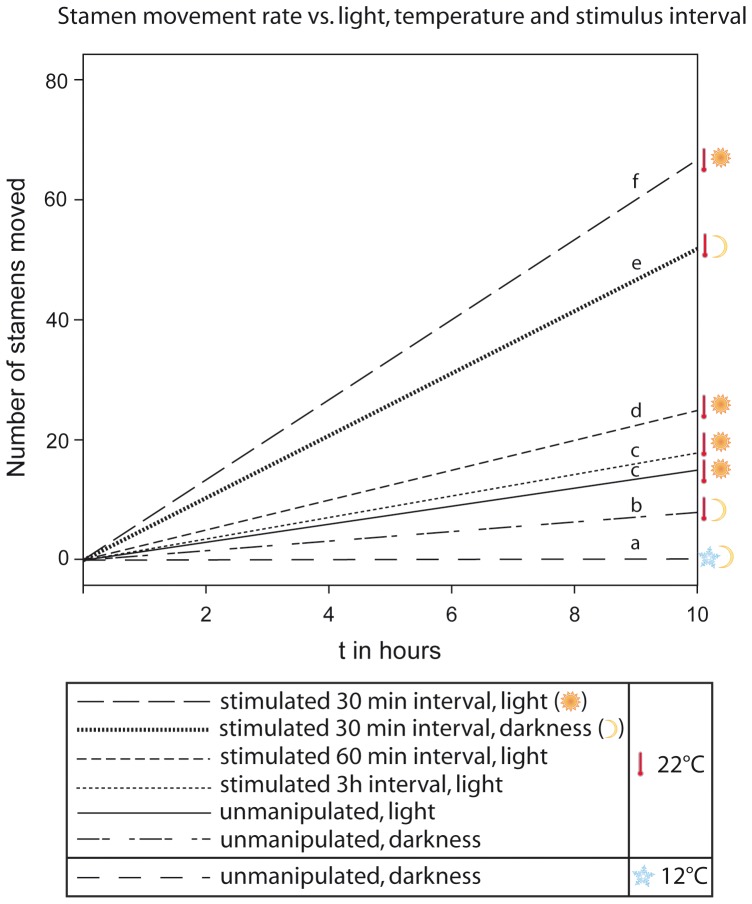
Figure 2. Rate of the stamen movement depending on different abiotic factors and visitation rates in Nasa macrothyrsa.
Different letters indicate significant differences between the treatments in the number of stamens moved per unit time (gls model; P<0.05, Supporting Information S1).

