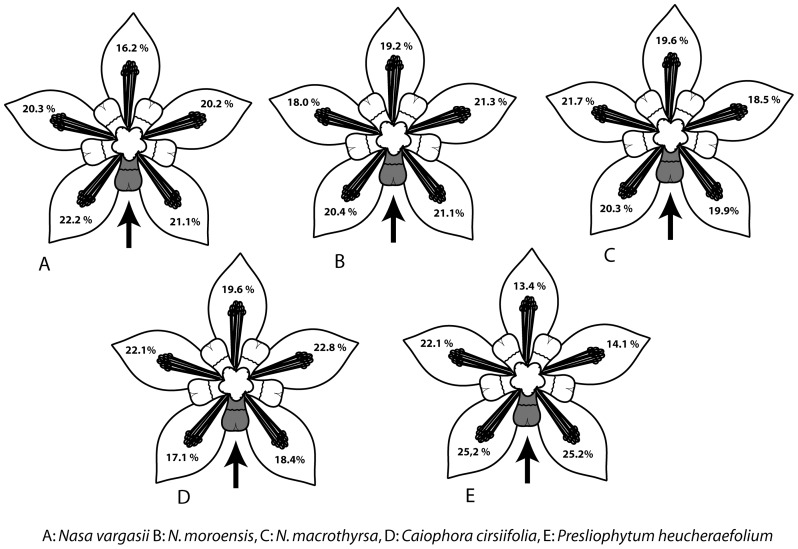
Figure 9. Summary of the data on the stamen origin experimentally obtained.
Grey filling/arrow = stimulated nectar scale. Stamen movements from individual stamen fascicles were summed up for five stimulations in 30 Min. intervals. Percentage of stamen movement for each fascicle is given in the corresponding “petal”. A. Nasa vargasii, B. N. moroensis, C. N. macrothyrsa, D. Caiophora cirsiifolia, E. Presliophytum heucheraefolium.

