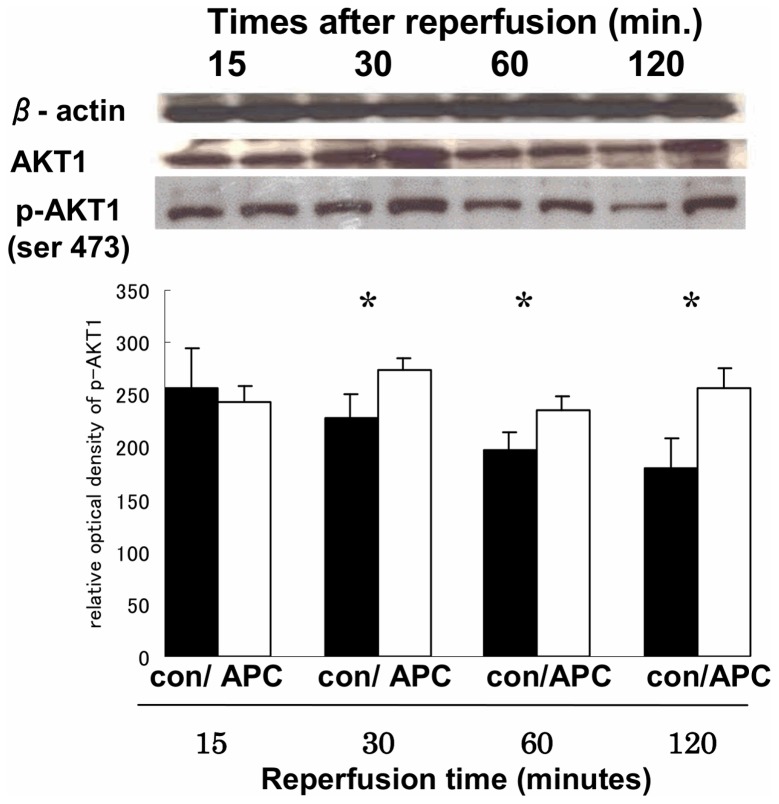
Figure 3. Representative Western blots for AKT1 and p-AKT1.
The photograph shows Western blots of myocardium for β-actin, whole AKT1, and p-AKT1in the global ischemia/reperfusion injury model during the time course. AKT1 was strongly detectable 30 min after reperfusion in the activated protein C (APC) group (p = 0.08, vs. control). The bar graph shows that p-AKT1 in the APC group was strongly and significantly expressed 30, 60, and 120 min after reperfusion, (* p<0.05; APC group versus controls).

