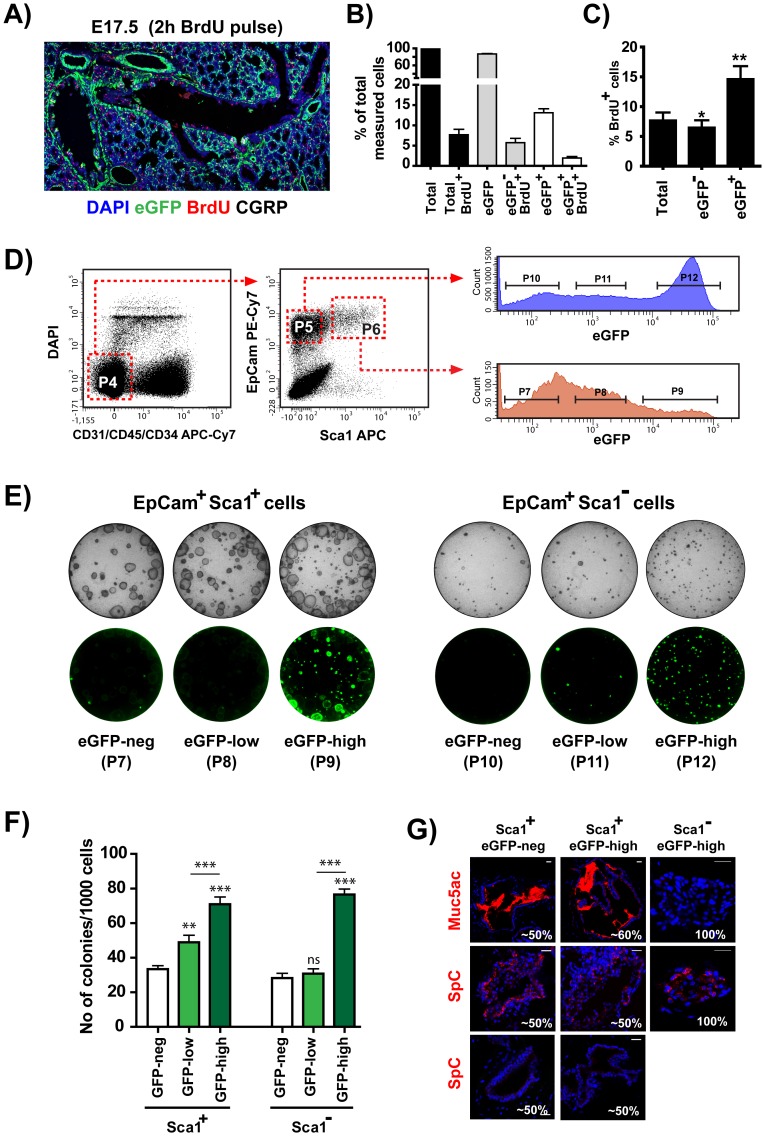
Figure 7. The eGFPpos epithelial compartments are enriched for in-vitro colony-forming epithelial progenitors.
A) Confocal image of an E17 lung tissue-section collected after a two-hour pulse with BrdU, stained for eGFP, BrdU, CGRP and DAPI. Colors are as labeled in the figures. Proliferating BrdUpos cells can be seen scattered all across the respiratory tree. B) Percentage of cells with the indicated characteristics in 8000–9000 airway epithelial cells counted per animal. C) Percentage of proliferating cells within each of the indicated epithelial population. Values represent mean ± SEM of six individually-analyzed animals. eGFPpos and eGFPneg groups compared to the “total” group using one-way analysis of variance (ANOVA) with Bonferoni's post-hoc test. D) Isolation of epithelial cell sub-populations by cell sorting. Single cell populations were prepared for cell sorting as described in Materials and Methods. Viable Linneg cells (gate P4) were subdivided into EpCAMpos-Sca1neg (gate P5) and EpCAMpos-Sca1low (gate P6). EGFPneg, eGFPlow and eGFPhigh cells from either EpCAMpos sub-population were isolated using a FACS ARIA IIu cells sorter. The purities of the sorted sub-populations were: for Sca1neg: eGFPneg (gate P7, ∼90%), eGFPlow (gate P8, ∼85%), eGFPhigh (gate P9, ∼90%); for Sca1low: eGFPneg (gate P10, ∼95%), eGFPlow (gate P11, ∼92%), eGFPhigh (gate P12, ∼98%). E) Representative bright field and fluorescence (eGFP) images of Day 8 Matrigel cultures seeded with 2000 cells sorted with the gates P7–P12 and co-cultured with Mlg stroma cells in the presence of 10 µM SB431542. Note the dominance of large cystic colonies in the Sca1low sub-populations and the dominance of smaller compact colonies in the Sca1neg sub-populations. After 8 days in culture the vast majority of the colonies from the eGFPlow cultured cells were eGFPneg. Almost half of the colonies from the eGFPhigh cultured cells were eGFPneg. The frequency of eGFPpos cells in the eGFPpos colonies ranged from 10–100%. F) Quantitation of the colonies produced in Matrigel by 2000 cells from each indicated sorted sub-population.Values represent mean ± SEM of eight independent experiments compared withone-way analysis of variance (ANOVA) with Bonferoni's post-hoc test. **P<0.01, ***P<0.001 (compared to the GFPneg group) and ###P<0.001 (eGFPlow vs eGFPhigh group). G) SB431542 was removed on day 8 and the Matrigel cultures were incubated for additional four days. Sections of the Matrigel cultures, prepared as described in Materials and Methods, were stained with anti-Muc5Ac and anti-SpC antibodies. All compact colonies derived from the Sca1neg sorted cells were SpCpos-Muc5Acneg. The cystic colonies derived from the Sca1low cells after the additional four days culture in the absence of SBSB431542contained Muc5Ac (∼50%) and SpC (∼50%) positive colonies. No Muc5Ac positive colonies were found in cultures with similar cells analyzed on day 8 before the removal of the inhibitor.

