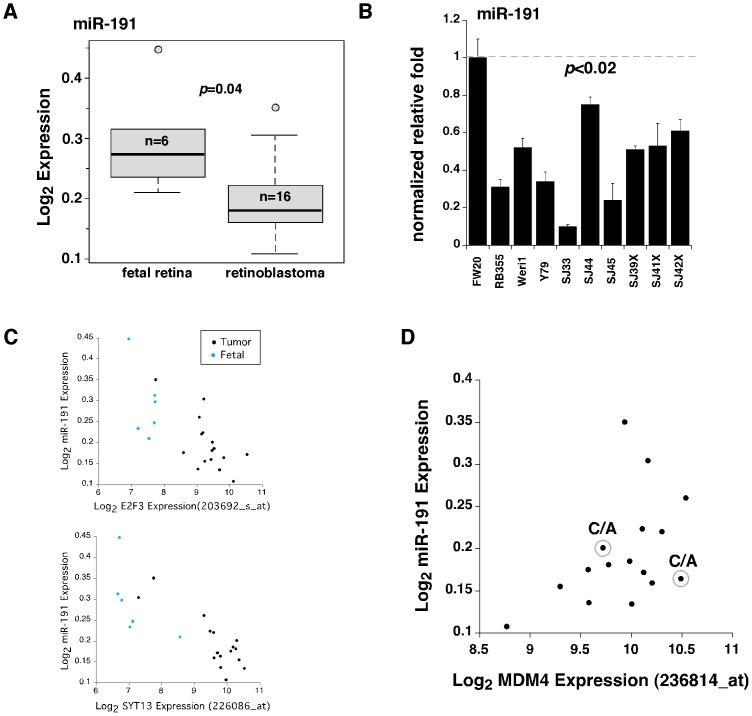
Figure 4. Analysis of miR-191 in retinoblastoma.
A) Boxplot of the Log2 expression for hsa-mir-191 probeset in 6 fetal retina and 16 primary human retinoblastomas showing significantly lower expression. (B) MicroRNA real time-RT-PCR for hsa-mir-191 in fetal retina at gestational week 20, retinoblastoma cell lines (Rb355, Y79, and Weri1), retinoblastoma primary tumors, and orthotopic xenografts. Values are normalized to fetal retina. (C) Scatter plots of the Log2 expression values for hsa-mir-191 and 4 of the representative 44 mir-191 target genes in fetal retina and retinoblastoma primary tumors. Affymetrix probeset in parenthesis. (D) Scatter plot of the Log2 expression values for hsa-mir-191 and MDM4 (Affymetrix probeset 236814_at) in retinoblastoma primary tumors. Circled are primary tumors with a C/A genotype.

